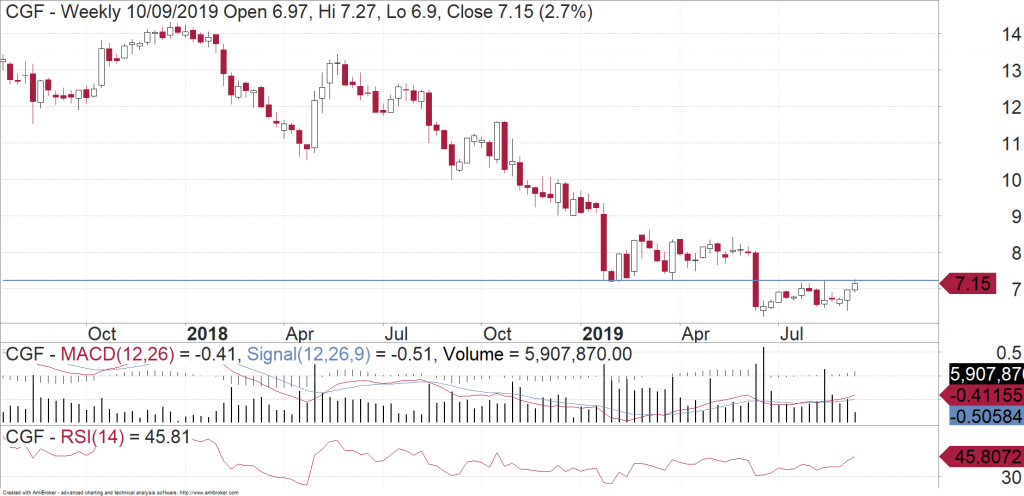
Challenger (ASX:CGF) has been a market darling for many years. However, the last 18 months has seen an almost halving of the share price. Does this mean that is now a fantastic buying opportunity?
Better-than-expected guidance for FY20 provided by Challenger at the recently-released FY19 results provided the market with short-lived hope that meaningful earnings growth was set to re-commence from FY21. This was after negative EPS growth over the last two years, as well as for FY20. We examine the factors likely to support future earnings growth and whether there are still some operational challenges that may continue to weigh on the share price.
About Challenger
Challenger is Australia’s leading provider of annuities and guaranteed retirement income products. The Company’s Life division, which accounts for over 90% of group operating earnings, is regulated by the Australian Prudential Regulation Authority (APRA). It broadly distributes products via financial advisers. These are both independent and within the major bank aligned channels. As an independent product manufacturer, the Life division has distribution representation on all major Australian hubs and platforms. These include AMP, BT, HUB24 and Netwealth.
The Life division is supported by strong long-term macro factors. In particular, an ageing demographic seeking retirement income solutions and Australia’s mandated superannuation. The retirement phase of superannuation is a high-growth market driven by ageing demographics, rising superannuation balances from mandatory contributions (which are scheduled to increase from 9.5% of gross salaries to 12.0% by July 2025), and changes in retiree risk preferences.
Implications from FY20 Guidance
The Company commented that challenging operating conditions are expected to persist for domestic annuity sales in FY20. CGF is targeting normalised Net Profit Before Tax (NPBT) of between $500m and $550m, which at the midpoint of the guidance range. It represents a 4.2% decline on FY19. This was taken as positive news, as the market had expected that CGF would reduce the top end of its FY20 guidance range. The decline in NPBT for FY20 vs FY19 is due to:
i. Low domestic annuity book growth as a result of ongoing adviser disruption. In particular, the adviser industry remains in a state of disruption following the Royal Commission. Advisers are distracted by compliance issues and industry structural changes to onboard new clients and recommend annuities. Domestic annuities declined by 4% in FY19 due to adviser and industry disruption. Further, annuity book growth has slowed from +7.3% in 1H18 to +1.6% in 2H19.
ii. A higher cost-to-income ratio as a result of investment in Distribution, Product & Marketing (DPM). This is considered necessary in order to drive demand for annuities and to increase the allocation made to annuities via retail advice. The normalised cost-to-income ratio remains low, at 32.6% and broadly in line with FY18. However for FY20, CGF expect the normalised cost-to-income ratio to trend above the 30-34% target range due to DPM initiatives. This cost-to-income target range has been in place since 1H18, from a 32-36% target range that was in place from 1H15 to 2H17. Expense growth in FY20 (excluding DPM growth initiatives) is expected to be <5%, compared to flat cost growth in FY19. After FY21, the cost-to-income ratio is expected to continue to fall, as the Company extracts scale benefits.
Are the strategies implemented to support profit impacting credit quality?
For FY19, CGF’s Life’s asset risk charge increased to 13.3%, from 12.6% at 1H19. This suggests that the Company is looking to ease pressure on profit from a lower interest rate environment. It would most likely be by recycling higher risk asset returns into annuity rates in order to assist sales.
However, as CGF is increasing its risk profile, its credit quality is taking a turn for the worse. Even though the credit charge remains below its average expected loss rate of 35 basis points, there was a disturbing increase in the FY19 losses to $32m, representing a loss of 27 basis points. In context,
i) This figure is much larger than the loss rates currently experienced by many banks, and
ii) It is above CGF’s 5-year average credit default loss of 18 basis points per annum and is surprising given the relatively benign credit environment amidst record low interest rates.
The significance of the extent of credit default losses is that normalised profit assumptions include an allowance for credit default losses, which may increase as CGF moves up the risk spectrum within in its fixed income portfolio.
Overall Fundamental View of Challenger
While the longer-term investment case for CGF remains attractive, we consider that the FY19 results, rather than signify an inflection point in earnings, serve to highlight a number of operational challenges for the Company that are likely to limit a re-rating in the shares.
How does the chart look?
CGF has not been trading well during the last 18 months. In January it gapped down and then struggled to make much headway by forming a symmetrical triangle. These patterns usually see the stock break out into the direction of the preceding trend. And this is exactly what happened when CGF broke down in June. Once again it has failed to make much headway In the last few weeks it has retested the upper limits of the June-July range (horizontal line) before pulling back again on large volumes. Because of the way CGF is trading here, we would expect the shares to continue to head lower during the course of the year and there is therefore no rush yet for investors to be buying in. The next major support level is down near $5.


