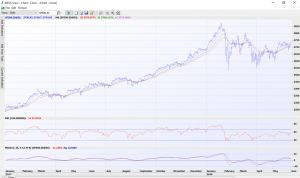
I think there is no doubt that virtually on any metric, equity markets look lofty at current levels. The relentless run to end 2019 and start 2020 reminds very much of what happened at the end of 2017 and the start of 2018. Need to refresh your memories? Just take a look at the chart below.

2017 was a year where equity markets grinded higher throughout the year in a general uptrend before accelerating into a parabolic move into January 2018. On January 26th they peaked. What happened next was a short sharp sell off that in the space of a week, undid four months of gains. That was a high price to pay for “chasing” the market in the final month of the rally.
More importantly, if you were to have bought in January 2018 and held, it took nine months to begin registering any profit on that investment. Timing is crucial and makes such a difference to your returns. Knowing when odds are skewed more to risk than they are to return are vitally important.
Clearly now, in my view, markets are skewed very much towards risk then they are to return.
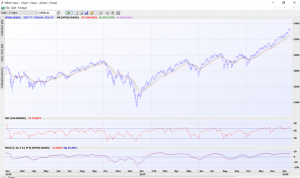
A look at a current chart of the S&P 500 shows a striking similar behaviour to 2017/2018, with January a month where the gains once again have turned more parabolic and more stretched.

As markets approach this end of January period (like in 2018), the question becomes how justified are equity valuations at these levels. Can the US reporting season not only justify the current valuations but also provide scope for further gains – and immediately? I find it very difficult to see that to be the case and sit in the camp that there could be a very aggressive about face in the direction of equity markets at these levels. At the very least it is a time for caution and profit-taking.
Unfortunately often in times of such uptrends, making meaningful profits requires time in the market. However, the longer that time required, increases the chance of a spike in volatility that can quickly undo all that time in the market and more. Hence, why buying on dips, corrections or during a breakout following a lengthy consolidation. We have none of those now. Furthermore, the typical technical warning signs are present with bearish divergence evident on indicators like the relative strength index and the MACD.
Of greater significance is the warning sign the bond market is displaying. In my twenty-plus year career in picking and trading markets, nearly every major volatility spike has been preceded by some warning sign from the bond market. My job is not to predict what the causation is, but rather the effect. So when the bond market begins to show signs of a “risk-off” event at the same time as stock markets are at extreme levels, I pay attention.
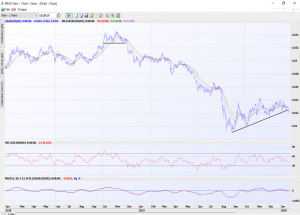
The chart below is of the US 30-year Treasury bond yield and as can be seen, this is starting to break down through trendline support that suggests at least a 20 basis point drop in yields. Bonds move inverse to yields, so the question beckons why could there be a sudden buying of bonds in a flight-to-safety move. Remember equity markets do not like rapid changes in interest rates – up or down. We can point to any number of reasons for a rush to the safety of bonds – coronavirus spreading, Iran tensions, series of bad economic data etc, with any of these triggering a sell-off in equity markets. My worry is that there will be a vacuum of buying support for equities which can lead to a January 2018 style peak.

At the same time as bond yields look vulnerable, gold prices also look very attractive. Other telltale “risk-off” markets such as Japanese yen strength too suggest caution is highly advisable. Volatility levels are at extreme lows and put/call ratios are also at lowest levels seen in years. Complacency seems to be the overall sentiment.
I look at markets in another way. Apple has gained $100 since October, rising from $220 to $320 and in the process created an additional US$420 billion dollars in value. Just in this one stock alone where there were no new products and certainly there was not that equivalent value sold in products across the world. So what is US$420 billion based off? The answer is the dangerous world of exchange-traded funds (ETF). As Apple and Google are now trillion-dollar companies, when any buyer of an ETF say purchases $100,000 of an ETF that tracks the S&P 500, a large portion of that $100,000 is used to buy Apple and Google shares. This funnels the majority of new money coming into the market into a small concentration of stocks. This is why some 70% of the gains in US equities have come off the back of less than ten companies. The only issue is when the selling emerges the same problem exists on the way out, the selling is overly concentrated in a small number, but very large market capped stocks that have a big influence on the major indices.
Markets are dangerously setup for a classic case of up the stair well down the elevator shaft.


