Gold’s haven reputation took a serious beating, with prices tumbling as investors sought to free up cash amid a broad and devastating market rout. Sound familiar? Sure, it’s the story of gold for much of this month. But that’s only half the answer.
It’s also a scenario that played out in the depths of the 2008 global financial crisis, right before gold started a years-long rally that culminated in the 2011 price record still in place today.
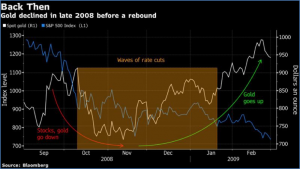
For many analysts and investors, the parallels with 2008 suggest there’s a good chance that gold will bounce back strongly after this month’s pummelling.
“If its price trajectory proves similar to 2008, we could see the precious metal’s benefits resurging as market stress continues to assert itself,” said Catherine Doyle, an investment specialist in the real-return team at Newton Investment Management. “We continue to have significant exposure for this very reason.”
While there’s concern that the impact on the global economy from the coronavirus could be worse than the last global financial crisis, many also expect a bigger policy response.
Another similarity with 2008 is that, while gold has fallen in recent weeks, the drop has been far outpaced by declines in equity markets and other commodities, so its relative purchasing power has risen, said Matthew McLennan, head of the global value team at First Eagle Investment Management, which manages about $101-billion in assets.
Still, gold may have further to fall before it’s ready to rebound, assuming macro markets follow the playbook from the global financial crisis, Citigroup Inc. analysts said in a report Monday. They see the potential for the metal to touch fresh nominal highs above $2,000 an ounce in 2021. (Courtesy of Bloomberg)
Gold is the Best-Performer of the Past Two Decades
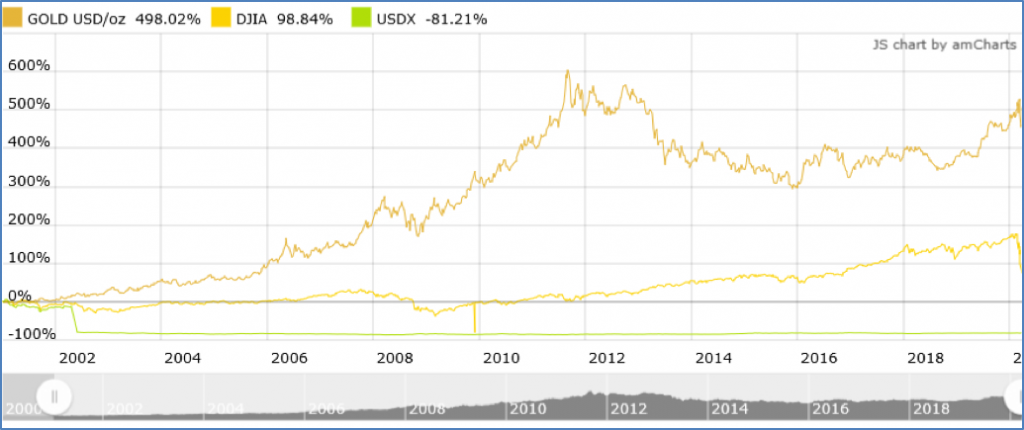
While equities tend to dominate the headlines, it has been the star performer of the past two decades. The graphic below shows how gold has outperformed both the Down Jones and the US Dollar since 2001. Gold is up 498% compared to the Dow up 98% and the dollar down 81%. Gold is the quiet achiever!!
The World Gold Council this week has reported that central banks and supranational organisations, such as the International Monetary Fund and the Bank of International Settlements, currently hold nearly 34,000t of gold as reserve assets. The council puts the primary reason for recent gold buying down to heightened economic and political risks, low negative interest rates and the rebalancing of allocations.
Official holdings represent 17% of total above-ground stocks of gold, an asset that universally ticks the investment boxes of all the world’s State-controlled central banks. The council calculates that in dollars, gold has provided an average yearly 10% rate of return since 1971, owing in part to its liquid and value enhancing market that has been attracting significant exchange-traded fund (ETF) opportunities for the private sector since 2003.
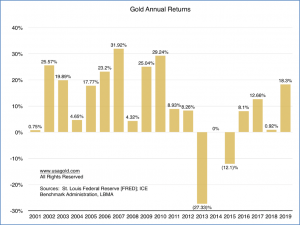
Another significant chart is the one below, which shows that gold has produced positive returns in 16 of the last 19 years and its average annual return compounded since 2001 is 9.47%. (2001-2019). Gold’s appreciation over the past 12 months is 20% – even taking the recent correction into account. Longer-term, a $100,000 investment in gold in January 2001 would be worth about $550,000 today.
A Recovery Underway in China?
Steel and copper inventories in China fell last week for the first time in months, exchange and consultancy data showed, as downstream metal consumers severely hit by the coronavirus come closer to restoring normal operations. Total steel product stocks in China stood at 37.05 million tonnes, according to Mysteel.
That was down 4.8% from 38.91 million tonnes a week earlier and marked the first drop since Dec. 19 as the traditional stock build ahead of the Lunar New Year was exacerbated by a virus-driven collapse in demand. Inventories of copper in warehouses tracked by the Shanghai Futures Exchange fell 0.7% from the previous week’s near four-year high to 377,247 tonnes, the first dip since Jan. 10.
In the virus epicentre of Hubei province, fabricators of copper products – widely used in power and construction – have not fully restored production but companies everywhere else in China essentially have, an industry official overseeing the sector said. “Medium-to-large sized firms that have resumed production are mainly back to pre-epidemic levels,” the official said.
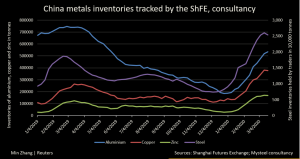
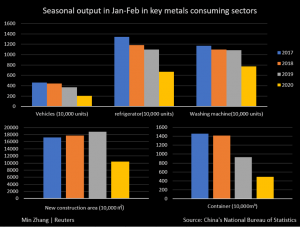
Industrial output in China contracted at its sharpest pace in 30 years in the first two months of 2020 but the latest inventory declines indicate manufacturing and construction are returning to normal.
Steel and copper inventories in China have fallen for the first time in months, exchange and consultancy data showed, as downstream metal consumers severely hit by the coronavirus come closer to restoring normal operations. “Medium-to-large sized firms that have resumed production are mainly back to pre-epidemic levels,” the official said. (Courtesy of Reuters)
Black Swans: Short-term Crisis, Long-term Opportunity
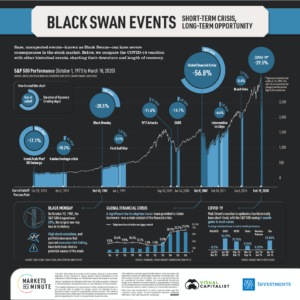
Few investors could have predicted that a viral outbreak would end the longest-running bull market in U.S. history. Now, the COVID-19 pandemic has pushed stocks far into bear market territory. From its peak on February 19th, the S&P 500 has fallen almost 30%.
While this volatility can cause investors to panic, it’s helpful to keep a long-term perspective. Black swan events, which are defined as rare and unexpected events with severe consequences, have come and gone throughout history. In the following Markets in a Minute chart from New York Life Investments, we explore the sell-off size and recovery length for some of these events.
Wars, Viruses, and Excessive Valuations
With sell-offs ranging from -5% to -50%, black swan events have all impacted the S&P 500 differently. While the declines can be severe, most have been short-lived. Markets typically returned to previous peak levels in no more than a couple of months. The Oil Embargo, Black Monday, and the Global Financial Crisis are notable outliers, with the recovery spanning a year or more. After Black Monday, the Federal Reserve reaffirmed its readiness to provide liquidity, and the market recovered in about 400 trading days. Both the 1973 Oil Embargo and 2007 Global Financial Crisis led to U.S. recessions, lengthening the recovery over multiple years.
COVID-19: How Long Will It Last?
It’s difficult to predict how long COVID-19 will impact markets, as its societal and financial disruption is unprecedented. In fact, the S&P 500 reached a bear market in just 16 days, the fastest time period on record. Some Wall Street strategists believe that the market will only begin to recover when COVID-19’s daily infection rate peaks. In the meantime, governments have begun announcing rate cuts and fiscal stimulus in order to help stabilize the economy.
Considering the high levels of uncertainty, what should investors do?
Buy on Fear, Sell on Greed?
Legendary investor Warren Buffet is a big proponent of this strategy. When others are greed – typically when prices are boiling over – assets may be overpriced. On the flipside, there may be good buying opportunities when others are fearful. Most importantly, investors need to remain disciplined with their investment process throughout the volatility. History has shown that markets will eventually recover, and may reward patient investors. (Courtesy of Visual Capitalist)
A Heavyweight Oil War of Attrition
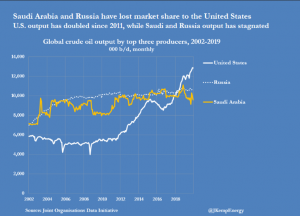
The graphic below highlights how Russia and Saudi Arabia have lost market share to the US over recent years, due to the explosion of shale oil – driven by higher oil prices. The million dollar question now is how will US shale oil survive in a much lower price environment? (Graphic courtesy of John Kemp, Reuters)
