In my last column I indicated it was time to begin taking profits into the final push higher in equities, and the weakness seen this week highlights why it is so important to gauge broader market sentiment and to be aware when the risk profile of being long rises.
In the past week we had seen a “dash for trash” especially in the USA where stocks in bankruptcy protection like Hertz surged many multiples in 1-2 trading sessions. This is the exact by product of some of the factors that I discussed in this very column – the huge increase in retail investor interest spiking. I discussed it here The Next Tech Bubble The Biggest Ever?, where account opening volumes and google search terms like “how to buy stocks” rose to be the highest during the market rout.
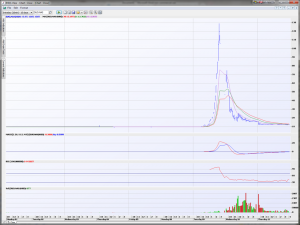
Unfortunately many of these newly market participants are not very sophisticated and chase things in herds. A case in point is FANGDD. This is some Chinese listed property stock (thinly traded in the USA) but it surged from $10 to over $120 in hours as these newcomers thought they were actually buying a FANG ETF – the acronym given to Facebook, Amazon, Netflix and Google. The incredible run is shown below and take into account this chart is a 10 minute chart. Naturally when idiocy like this emerges it’s time for the market to hand out a few lessons and that’s exactly what it did 24 hours later with the DJIA dropping 1800 points.

Domestically stocks like Flight Centre and Webjet commanding market caps now larger than what they did before this pandemic started is also examples of signs that things were too heated and why it was time to start taking profits. I also like to be a day too early than a minute too late when it comes to selling.
Is this the peak in the market and its now due for another major leg lower to potentially retest the lows? No I don’t think so. I stand by my views since the lows that the combination of Fed liquidity, the economy re-opening and the Covid-19 crisis focusing investors on the big next big “tech wave” of stay at home and remote activities will drive some of the most ridiculous valuations and price moves ever seen in history. What we have seen is nothing yet.
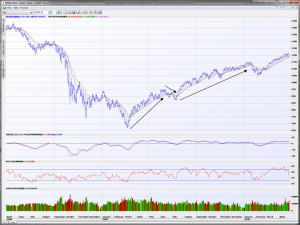
The return of volatility is nothing different to what was witnessed during the 2009 recovery as well. Mid-June 2009 saw the vertical style rebound off the March lows (sound familiar?) peak and trigger a 9% pullback (shown below). IN fact the peak in June 2009 is exactly the same date as that of 2020 this week. The rally off the March lows is almost identical too. Why? Because herds act in very similar fashion to the same circumstances of stress, fear, regret and greed.

Once markets peaked in June 2009 there was little direction for a couple of months before resuming the uptrend. Expect the same here again. It may not take as long to get going again as the actions by the Fed and Governments is far greater now than in 2009. Basis this not only could the pause be shorter but most likely the resuming rally will be even more robust.


