Two weeks ago I discussed how after being extremely bullish and seeing a plethora of opportunities in March through to June, I found that the number of attractive buys out there had dwindled. Moreover, I found many bears that I argued with in March and April were now echoing my positive views.
Last night (Thursday US session) we witnessed some aggressive selling in the leading technology names and although I think they will go significantly higher as part of the “largest bubble we have ever seen”, there is need for a pause, pullback and profit taking.
One concern for me to my bubble theory is a Joe Biden US Presidential victory combined with a Democratic win in the Senate. That will allow many of the higher tax policies (and new taxes like on share trading) to be implemented. While the US is in need of some wealth tax to address the widening income and wealth gap, a specific focus on corporations and share trading will be damaging. A failure to win the Senate by the Democrats would naturally remove much of these concerns.
Seasonally we have also entered a period which has shown heightened levels of volatility – August to October. Following such a record run in the market it just makes sense to take profits and be cautious. As I say, all the easy money has been made in the market’s mis-pricing due to Covid in March and now that risk has shifted. It probably explains why when looking at the charts there are more worrying signs than anything that suggests its time to commit more risk to the market.
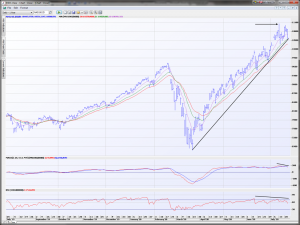
Firstly, the Nasdaq-100 last week made its peak with what is known in charting circles as a “key reversal”. This bar sees the market push through to new highs, reverse and then close on its low, with the day’s range being larger than that of the prior day. To date that reversal is still the record high. There has been ongoing bearish divergence between technical indicators and the physical index. This occurs when the index makes new highs but the indicators don’t, a sign that momentum is being lost. To this point, insider selling (management) vs insider buying has reached a ratio of 5:1. Directors have been dumping stock at these lofty prices. If they are, I think its wise to do so too. Especially if the supporting trendline from the March lows is breached. Could spark some further exodus from the market leaders.

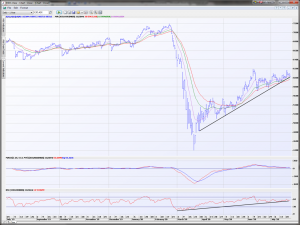
A look at the ASX 200 and again the outlook does show downside vulnerabilities. A similar supporting trendline that comes in around the 6000 level, bearish divergence on technical indicators and a failure this week to breach the June highs.

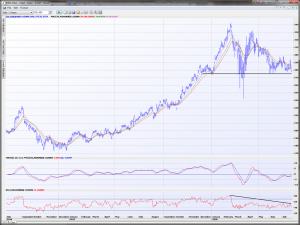
While certain stocks at the individual level still show promise areas that are very vulnerable are banks and the buy-now-pay-later “fintech” stocks. Throw in some of the retailers like Kogan and Australia’s largest company CSL as well. I mean just look at this broad top formation that CSL has been forming for the past nine months. It appears poised to break lower under $278 and head down to $250/250.

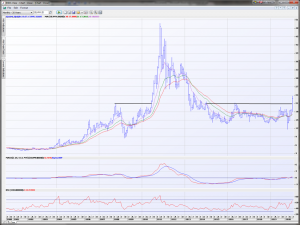
One area that I see enormous upside in is Silver. This week silver surged and is now breaking out from a multi-year base. I mentioned this phrase in a column a couple of years ago on gold, when it did the same thing, “this is a once in decade breakout – it is worth taking part in serious way”. Silver is enjoying all the tailwinds gold prices are but just with a significant lag and even the run up in 2010 just shows how rapidly and just how far silver can run.


