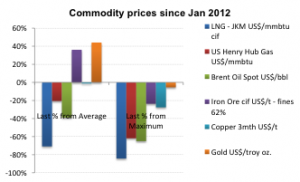
US Gas and Spot LNG prices have been among the poorer performers of major traded commodities over the decade. Spot prices are respectively trading 26% and 71% below average level since 2012 and are well off their price highs. This mirrors oil price’s poor performance. This is unlike spot levels of gold and iron ore that are 44% and 36% above average prices since 2012, while copper’s price is close to its average level.

US gas markets a driver for Spot LNG
Both US gas and global LNG have experienced supply growth due to US horizontal drilling/rock stimulation and commissioning new LNG trains from Australasia, Russia, East Africa and the major new export driver – the US. Our view is – what happens in the US influences spot LNG prices.
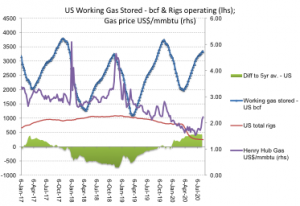
Cheap US gas and renewables have been dominating new US power generation. However, the shock of Covid-19 has cut gas US demand trend growth from around 6% pa to zero, and in May was down 2.4% YoY. Continued but decelerating US gas supply growth and slowing of US export LNG cargoes through JunQ20 saw excess US gas stored grow to 440bcf, but recently this surplus has been plateauing (See green shaded section in chart below). We see this as evidence of a major producers’ response via the collapse of actively drilling rigs in the US – view the red line below.

The recent run in Henry Hub gas from punishingly low prices of under US$1.50/mmbtu to US$2.36 has been assisted by favourable weather variables, but also comes atop of a cumulative withdrawal of sustaining capital that enables growth of deliverable US gas supply.
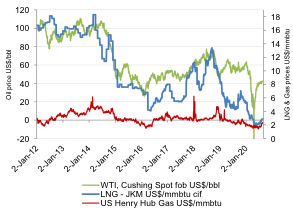
US gas and LNG have lagged the oil price recovery – is it time to at least partially close that gap?

The global LNG market needs significant demand growth (particularly post Covid-19) to digest the added supply. Major price rises will likely take time, however current LNG margins above US feedstock prices appear unsustainably low. There is an improving chance for some improved LNG pricing above its recent modest price recovery.
The US is the LNG market’s emerging swing supplier. A potential catalyst this analyst is watching – is US gas storage and US prices that can feed directly influence LNG spot pricing.
Sources for charts: US EIA, Baker Hughes


