Purchasing managers and investors daily decisions to buy or sell commodities provide an up to date gauge on key activity and supply conditions compared to lagging economic data. By monitoring and comparing steel prices in China and the US it has helped us identify commodity and currency trends during this period of heightened uncertainty.
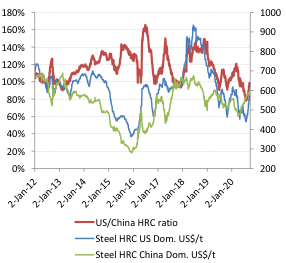
In July 2020, Chinese steel prices were rebounding (see Chart-1 green line) to pre-Covid-19 levels. Meanwhile, US prices (the blue line below) languished to such an extent that the ratio of the US hot-rolled coil (HRC) steel price to China’s HRC steel prices fell to 78%. This was a new low and compares to the average of the two country’s steel price ratio of 117% since 2012. See Chart-1’s red line which represents that ratio.
This analyst viewed that observation as a strong indicator that China’s economic rebound was both strong and well ahead of the US economy’s rise from its Covid-shutdown lows. The US dollar’s allure as a safe haven became less valued and capital avidly sought renewed growth. The US dollar index (versus its trading partners) has fallen a significant 4.6% since early July. However, things are never static and the US to China steel ratio is now rebounding. More on this shortly.
Chart-1 – US (Hot-rolled Coil) Steel Price and China’s HRC Steel Price US$ (rhs)
Ratio of US Steel price to China’s steel price in red (lhs)

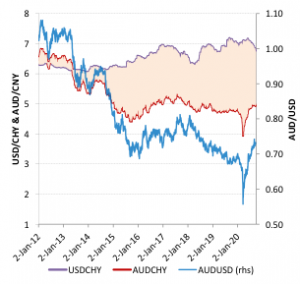
The implications of China’s stronger and early bounce have been widely felt. This included the recovery of commodity prices which are heavily reliant upon China’s demand, with iron ore’s rise a prominent example. In Chart-2, China’s relative economic strength saw both the Chinese Yuan rise against the US dollar (represented as the purple line falling), and the commodity sensitive Australian Dollar to US dollar rising as well (blue line). Interestingly the Australian Dollar versus the Chinese Yuan has regained all its 2020 losses to now trade higher than 2019 levels. The recovery trend has been strong enough for the capital market to date to seemingly ignore recent Australia to China agricultural trade interruptions.
Chart-2 caption – China’s Yuan recent strength versus US dollar (lhs; purple line falling).
Australian dollar’s strength versus the US dollar (rhs; blue line rising)

Referring back to Chart-1, the HRC ratio has rebounded from the July low by a significant 21% points, back to 99%. While US steel prices to China’s price remains below its average suggesting China’s overall growth advantage, it signals to us that the US economy is rebounding, though in a lagged fashion. Low US interest rates are now having a growing impact on domestic spending. This includes dwelling investment, renovation for the work-at-home and some segments of retail spending.
Should Chinese steel prices remain firm and the US steel price recovery trend continue, the result may be that the recent rise of the Chinese Yuan and Australian dollar may slow or consolidate. In this new phase, it is perhaps is less likely to see the Yuan and AUD strength significantly reverse. While a US activity rebound may attract more capital and support the US dollar somewhat, this will be balanced against a broadening of global growth, that is generally positive for non-US currencies including commodity producer currencies. Big falls in steel pricing and a strong rise in the US dollar is potentially a worrying signal as it could indicate renewed safe-haven buying and falling confidence in global growth momentum.
Watching various and relative steel pricing trends can provide a timely indicator whether the currently positive US and Chinese growth rebound trends can continue to support the price recoveries of commodity prices and of our key ASX resources stocks.
Sources: RBA, Bloomberg and Industry data


