Key points
- The history of cyclical bull markets in shares suggests that the rebound since last March still has a way to go.
- But it’s normal for the second 12 months of a cyclical bull market to see slower returns from shares.
- While shares are vulnerable to a further correction triggered by the spike in bond yields, we are not seeing the sort of unambiguous overvaluation, economic overheating, monetary tightening and investor euphoria normally seen at cyclical tops.
We are now coming up to the one-year anniversary of the low in share markets following the pandemic driven plunge a year ago. From their lows on 23rd March last year, US shares are up 73%, global shares are up 66% and Australian shares are up 53%. After such a strong rebound, there are naturally concerns that the new cyclical bull market in shares is at risk, particularly given the surge in bond yields. The counter argument is that it’s too early in the investment cycle to expect the bull market to be over. This note looks at where we are in the investment cycle.
The history of cyclical bull markets since WW2
When thinking about this issue, it’s always useful to start by having a look at past cyclical bull markets in shares. The next table shows cyclical bull markets in US shares since World War 2.
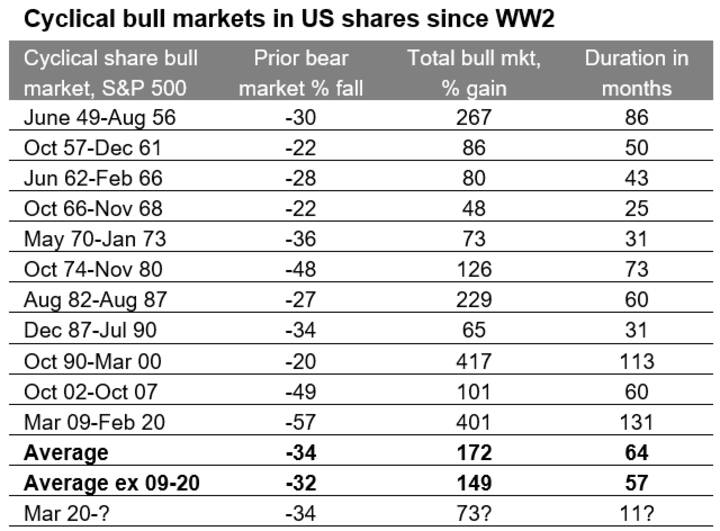
Data is for the S&P 500. A cyclical bull market is defined as a rising trend in shares that ends when shares have a 20% or more fall. It could be argued that the 20% fall in July to October 1990 was not really a bear market as it was too short & shares surpassed prior highs within a year. Likewise, it could be argued that there were bear markets in 2011 and 2018 as shares fell by nearly 20%. Source: Bloomberg, AMP Capital.
The average cyclical bull market in the US has seen shares rise 172% and last 64 months. Even if last decade’s long bull market is excluded, the average cyclical bull market is still 149% over 57 months. The next table shows cyclical bull markets in Australian shares. The average gain is 116% over 46 months, which is a bit less than in the US, partly reflecting two bear markets last decade.
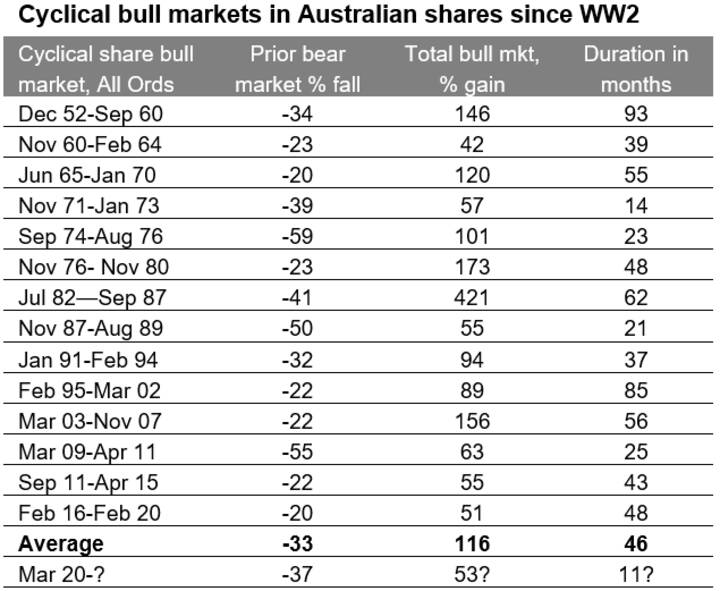
Source: Data is for the All Ords index, Bloomberg, AMP Capital
In this context, the rebound seen over the last year would be relatively short for a cyclical bull market if it were to end here. Of course, there is far more to bull markets than time and magnitude.
The investment cycle
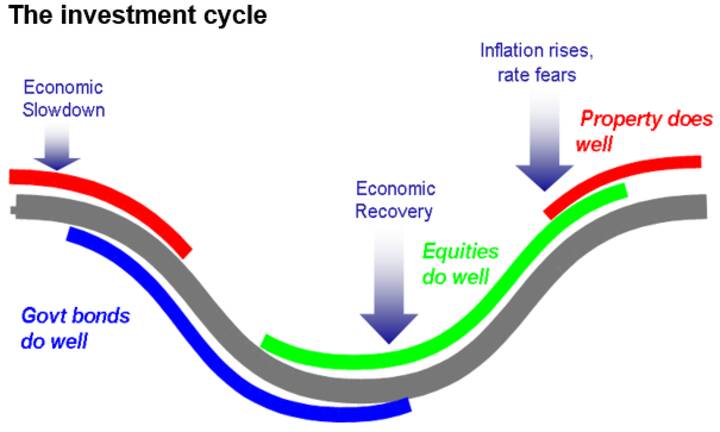
The next chart shows a stylised version of the investment cycle.
Source: AMP Capital
A typical cyclical bull market in shares – the green area in the chart – has three phases:
• Phase 1 normally starts when economic conditions are still weak and confidence is poor, but smart investors start to see value in shares helped by ultra easy monetary conditions, low interest rates and low bond yields.
• Phase 2 is driven by strengthening profits as economic growth turns up and investor scepticism starts to give way to some optimism. While monetary policy may start to tighten, it is from very easy conditions and remains easy as inflation remains low and so bond yields may be rising higher but not enough to derail the cyclical upswing in shares.
• Phase 3 sees investors move from optimism to euphoria helped by strong economic and profit conditions, which pushes shares into clearly overvalued territory. Meanwhile, strong economic conditions drive inflation problems and force central banks to move into tight monetary policy, which pushes bond yields significantly higher. The combination of overvaluation, investors being fully loaded up on shares and tight monetary policy sets the scene for a new bear market.
As seen in the previous tables, cyclical bull markets average around three to five years. But they vary depending on how quickly spare capacity is used up, inflation takes hold and extremes of overvaluation and investor euphoria appear. As a result, “bull markets do not die of old age but of exhaustion”.
And some bear markets can be triggered by exogenous shocks unrelated to an end of the cycle as in Phase 3. This was seen last year. There was no preceding overheating. In fact, many central banks – including the Fed and the RBA – were easing monetary policy prior to the pandemic cyclical bear market and recession. A new cyclical recovery has begun none the less.
The shifting of the gears after the first phase
It’s often the case that the second 12 months after a bear market ends sees more constrained and volatile gains in shares. As shown in the next table, the average gain in Australian shares in the first 12 months after a bear market ends is 28%, whereas the average gain in the second 12 months is just 7%. Similarly, the average gain in US shares in the first 12 months is 42%, followed by an average gain of just 8% in the second 12 months. This reflects a combination of the bear market undervaluation being removed by the initial rally, a shift in growth leading indicators from acceleration to expansion and the unwinding of stimulus. It’s basically a shifting of the gears between the first valuation recovery driven phase to a tougher earnings driven phase. It highlights of course the danger in investors thinking they will wait to get back in when uncertainty falls – but by then the easy gains have been seen.
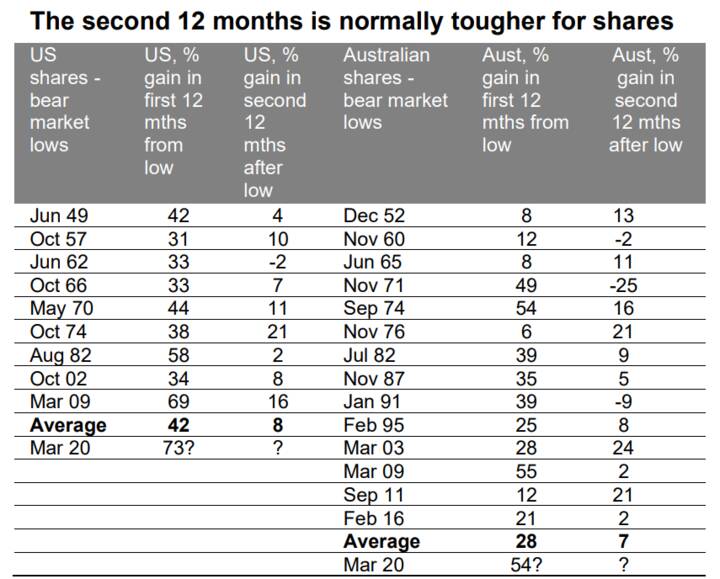
Data is for US S&P 500 and All Ords and covers the post WW2 period. Source: Bloomberg, AMP Capital
So where are we now?
Shares have had a big rally from their lows in March last year but it’s most likely that we are now in the transition between the initial recovery (Phase 1) and earnings driven growth (in Phase 2) and still a long way from the overheating and exhaustion that is evident at the end of a cyclical bull market. The best way to look at this is to assess market valuation, economic growth and inflation pressures, monetary conditions and investor sentiment.
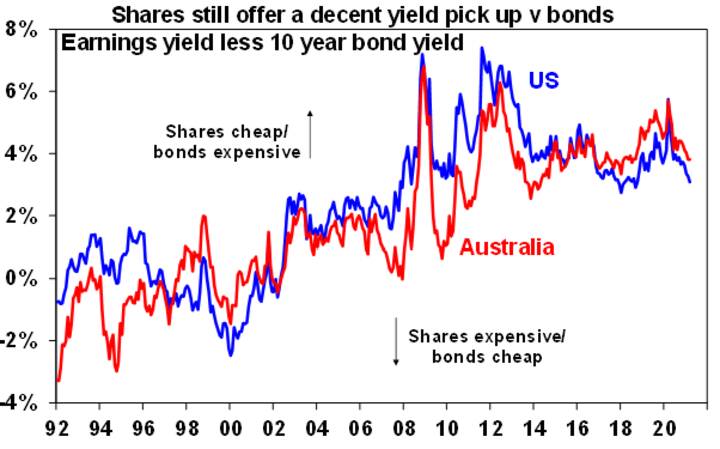
- Measured in isolation against their own history, shares are not cheap with forward price to earnings ratios well above their long-term averages. However, despite the surge in bond yields this year, shares still offer a decent earnings yield pickup relative to the bond yield (see the next chart).
Source: Bloomberg, AMP Capital
- The global economy is set for very strong growth this year helped by stimulus and vaccines. This in turn is fuelling a strong upwards revision in earnings expectations, with US December quarter earnings about 12% stronger than expected and Australian earnings growth for this financial year being revised up by around 13% since mid-January.
- While economic and profit growth is likely to be very strong this year, there is a still a long way to go to use up spare capacity in product and labour markets. This means that while headline inflation is likely to spike in the months ahead – due to the deflation of last year dropping out of annual calculations, higher energy and commodity prices and bottlenecks in some goods markets – underlying inflation and wages growth is likely to remain soft in contrast to the excesses normally seen prior to cyclical downturns
- As a result, while Fed and RBA rate hikes may come earlier than the three years or more that they often refer to, it is still likely to be at least two years away. And the ECB and Bank of Japan are likely even further behind.
- Finally, while investor optimism is high it doesn’t appear euphoric (Bitcoin periodically aside!). In Australia, sentiment towards shares as a wise destination for savings remains low and more investors still prefer bank deposits.
Investment implications
So, from a broad-brush perspective we are not seeing the signs of exhaustion that come at cyclical peaks and so the cyclical bull market in shares likely has further to go.
Of course, that is not to say that shares aren’t vulnerable in the short term to a further correction, in response to the spike in bond yields. In particular, high PE tech stocks remain very vulnerable after years of outperformance partly on the back of falling bond yields and they are less likely to see an offset from higher earnings growth. So far, they have borne the brunt of the correction. Ultimately this should leave cheaper, less tech heavy, non-US share markets including Australian shares better placed to outperform this year.


