Every large company was once a small company. The hard part for investors is to identify those small companies that will grow to be large companies. To use Chess as a metaphor, it’s about identifying those pawns, who will reach the eighth rank and become a Queen. At the start of any chess game any pawn has the potential to become a Queen and according to a new VanEck research paper the Quality Factor is able to generate higher alpha in small international companies than in large- and mid-international companies. The paper also finds that Australian investors have preferred local small companies over international small companies despite the better risk/return characteristics of international small companies.
Most Australian investors are missing out on the potential benefits international small companies can add to a portfolio. This is not because Australian investors are apprehensive about investing in small companies. We invest in Australian small companies with zeal, attracted to their potential growth prospects of the ‘size effect’. According to a review of Morningstar data, 17% of all money invested in Australian Equity Funds (ex ETFs) in Australia are invested in small companies funds. This compares with just 2% of all International Equity Funds (ex ETFs) being investing in international small companies.
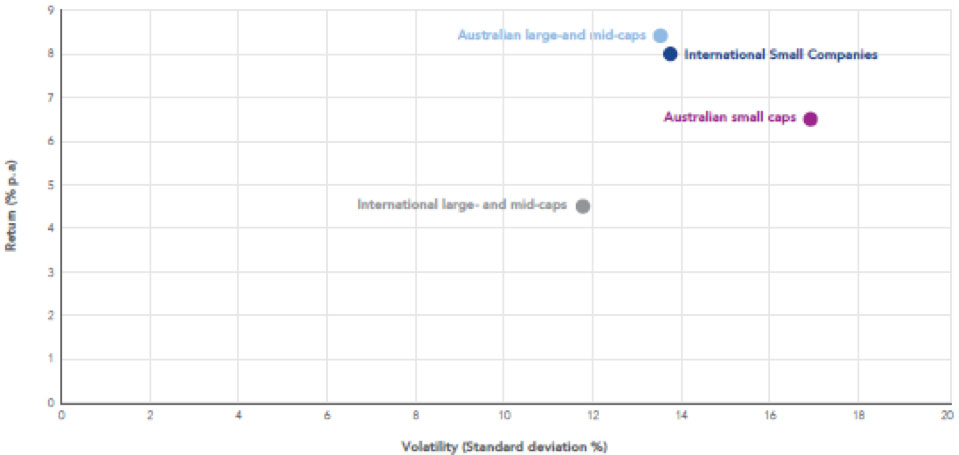
This is surprising when you consider the different opportunity sets and the better relative performance of the ‘size effect’ in overseas markets. The ASX represents under 2% of the developed global share market, hence the appeal of adding international equities to a portfolio. As figure 1 below demonstrates, international small companies have been less volatile and generated better returns than Australian small companies:
Figure 1: Small companies versus large- and mid-cap companies
Risk/Reward – December 2000 to March 2021-04-22
Source: Morningstar Direct; All data: from common Index inception date to 31 March 2021. MSCI World ex Australia Small Cap Index base date is 31 December 2000. Results are calculated monthly and assume immediate reinvestment of all dividends. You cannot invest in an index. Past performance is not a reliable indicator of future performance of the indices or QSML. Indices used: Australian large- and mid-caps – S&P/ASX 100 Index, Australian small caps – S&P/ASX Small Ordinaries Index, International large- and mid-caps – MSCI World ex Australia Index, International small caps – MSCI World ex Australia Small Caps Index.
Due to the high costs of investing in international small companies and the limited options available, it has been difficult for Australian investors to consider this asset class. A market capitalisation passive international small companies approach involves tracking the performance of over 4,000 companies that make up the MSCI World ex Australia Small Cap Index, or a representative or optimised sample. The benchmark, as evidenced by active manager outperformance, includes companies that are not attractive from an investment point of view. The same is true when you consider the international large- and mid- cap universe; not all of the 1,500 plus companies in the MSCI World ex Australia Universe are attractive from an investable point of view.
One factor approach that has shown historical outperformance in the large- and mid-cap universe is quality.i
A new research paper from VanEck, Finding the pawns that will become Queens: A guide to international small companies investing shows that quality is able to generate higher alpha in the small cap universe than in the large- and mid-cap universe – read it here
In summary, the paper finds that the Quality Factor is more pronounced in international small companies than international large-and mid-companies.
The paper cites research by academic Robert Novy-Marx whose article Quality Investing included an analysis of the impact of quality across the market capitalisation spectrum.iiNovy-Marx created ‘quality’ strategies constructed from the US-focussed Russell 1000 and the Russell 2000 indices. He then compared these ‘quality’ strategies against their respective parent benchmarks and analysed the performance using regression analysis. Regression analysis is a statistical method used to explain why something happened in relation to something else, in this instance quality fundamentals in relation to the broader US equity market.
Novy-Marx was able to illustrate that the quality strategies he assessed were able to “generate higher returns in the small cap universe.”iiiTo determine the efficacy of the quality approach to international small companies beyond the US-centric Russell 3000, the VanEck paper includes a similar regression analysis to Novy-Marx’s, this time using the MSCI World ex Australia Quality Index and the MSCI World ex Australia Small Cap Quality 150 Index (QSML Index) and their respective parent benchmarks.
Figure 2 below illustrates the respective alpha generated after stripping out performance attributed to the market and value/growth tilts using MSCI indices. Over ten years to 31 March 2021, QSML Index generated 3.22% alpha per annum, which is higher than the large-and mid-cap equivalent. Negative coefficient highlights that both quality strategies’ performance is derived from growth.
Figure 2: The quality factor in international small companies and in international mid- and large- companies
Impact of the quality factor, VanEck Regression Analysis
|
Index |
α (alpha) |
Coefficient | |
| βMKT (market) | βHmL (value minus growth) | ||
| MSCI World ex Australia Small Cap Quality 150 Index (QSML Index) | 3.22% | 1.01 | -0.32 |
| MSCI World ex Australia Quality Index (QUAL Index) | 3.11% | 0.95 | -0.24 |
Source: VanEck Research, 10 years ending March 2021. VanEck replicated Novy-Marx’s methodology to capture international small companies beyond US. Past performance is not a reliable indicator of future performance. You cannot invest directly in an index.
This is consistent with Novy-Marx’s findings. The alpha of quality international small companies is more pronounced than the alpha of quality international large-and-mid companies.
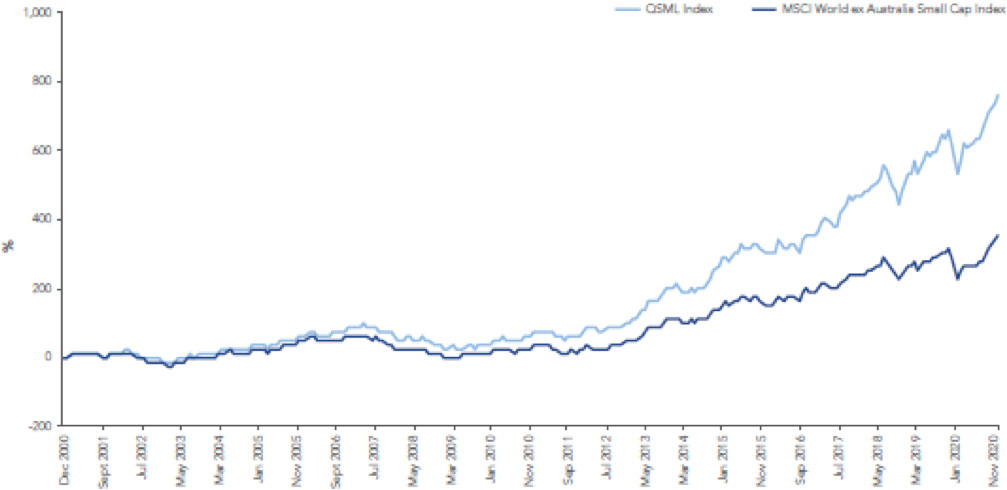
Figure 3: International quality small companies’ performance
Cumulative hypothetical performance comparison (%)
Source: Morningstar Direct, as at 31 March 2021. The above graph is a hypothetical comparison of performance of the MSCI World ex Australia Small Cap Quality 150 Index (“QSML Index”) and the MSCI World ex Australia Small Cap Index (“Parent Index”), from the Parent Index base date 29 December 2000. QSML Index performance prior to its launch in December 2020 is simulated based on the current index methodology. Results are calculated to the last business day of the month and assume immediate reinvestment of all dividends and exclude fees and costs associated with investing in QSML. You cannot invest in an Index. Past performance is not a reliable indicator of future performance of the indices or QSML. The Parent Index is shown for comparison purposes as it is the widely recognised benchmark used to measure the performance of developed market small companies, weighted by market cap. QSML Index measures the performance of 150 companies selected from the Parent Index based on MSCI quality scores. Consequently the QSML Index has fewer companies and different country and industry allocations than the Parent Index.
VanEck Vectors MSCI International Small Companies Quality ETF (ASX: QSML)
You can now invest in 150 quality small companies identified by MSCI via the VanEck Vectors MSCI International Small Companies Quality ETF (ASX: QSML), which tracks the QSML Index.
Click here to download a copy of Finding the pawns that will become Queens: A guide to international small companies investing
Important notice:
VanEck Investments Limited ACN 146 596 116 AFSL 416755 (‘VanEck’) is the responsible entity and issuer of units in the VanEck Vectors MSCI International Small Companies Quality ETF (QSML). This is general advice only, not personal financial advice. Read the PDS and speak with a financial adviser to determine if a fund is appropriate for your circumstances. The PDS is available at www.vaneck.com.au.
An investment in QSML has risks, including possible loss of capital invested. QSML carry risks associated with: financial markets generally, individual company management, industry sectors, ASX trading time differences, foreign currency, country or sector concentration, political, regulatory and tax risks, fund operations and tracking an index. See the PDS for details. No member of the VanEck group guarantees the repayment of capital, the payment of income, performance, or any particular rate of return from either fund.
QSML and QUAL are indexed to a MSCI index. The funds are not sponsored, endorsed or promoted by MSCI, and MSCI bears no liability with respect to QSML or the MSCI World ex Australia Small Cap Quality 150 Index, or QUAL or the MSCI World ex Australia Quality Index. The PDS contains a more detailed description of the limited relationship MSCI has with VanEck, QSML and QUAL.
iAbhishek Gupta, Altaf Kassam, Raghu Surtanarayanan, Katalin Varga (2014) Index Performance in Changing Economic Environments, MSCI Research Insight
iiNovy-Marx, Robert. 2012 (revised 2014). “Quality Investing.” Working Paper
iiiibid


