Introduction
There has been much concern about inflation this year – but why should it matter for growth assets like shares and property? Surely earnings and rents will just go up with higher inflation offsetting any negative impact from higher interest rates due to higher inflation? In reality, it’s more complicated. Our note two weeks ago had a look at the outlook for inflation – why the current spike should prove transitory, but more broadly why the long-term decline in inflation over the last 40 years or so may be over (see Inflation Q&A). This note takes a closer look at the impact of inflation on growth assets like shares and property.
What drives investment returns?
In considering the impact of inflation on investment returns the best place to start is a consideration of what makes up returns. The percentage return on an asset is driven by its income flow (or yield) and capital growth – which can be broken down into growth in earnings or rents and changes in valuations. So: Return = Income Yield + Earnings Grth + Change in Valuation
The first two components are fairly obvious and less interesting:
- The income yield is simply the flow of income the asset produces – whether its dividends in the case of shares or rent from property. It tends to be relatively stable over time.
- The second is the rate of growth in the investment’s earnings (or rents in the case of property).
- The third component is the portion of return due to changes in valuation which is basically where the asset’s price rises by more or less than earnings growth, resulting in rising or falling price to earnings multiples in the case of shares.
Cash & government bonds and inflation
For cash and bank deposits the income yield (or interest rate) is what matters and to the extent that higher inflation leads to higher interest rates investors in these assets can be protected. However, just note that interest rates tend to lag big moves in inflation so in the mid-1970s interest rates rose but not as quickly as inflation (as central banks and investors took time to realise that inflation would stay high) meaning investors went backwards in real terms. They only got ahead when rates overshot in the early 1980s and then inflation fell.
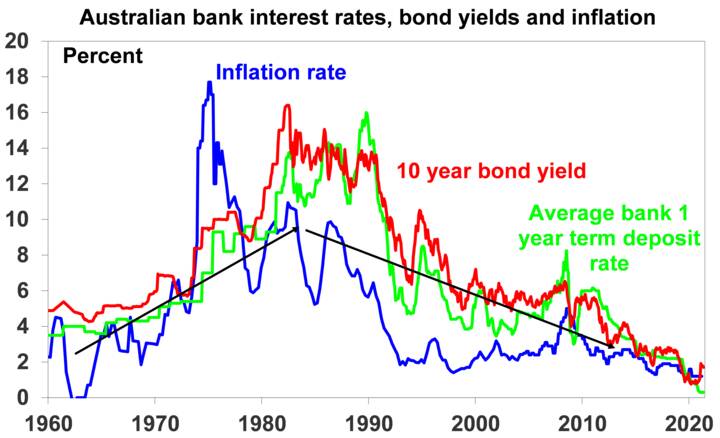
Source: RBA, Bloomberg, AMP Capital
For investors in government bonds there is no earnings growth and they suffer a capital loss when yields rise with inflation (ie, the change in valuation component goes negative). Ultimately, bond investors benefit from higher yields once they roll over their investments into the higher yields but in the interim, they are not protected. Inflation linked bonds paying a yield linked to inflation are the best protection for bond investors.
Changes in PEs have a big impact on share returns
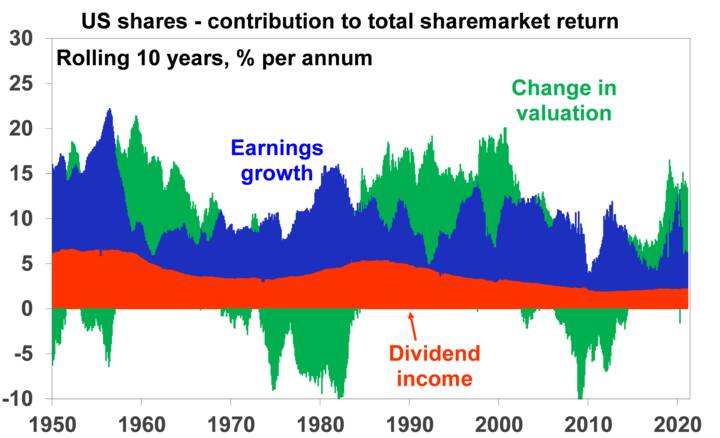
For shares and other growth assets a big driver of the impact of changes in inflation comes through changes in the price to earnings ratio (or price to rent ratios for property). Price to earnings multiples can be volatile in the short term as the share market anticipates swings in earnings and due to changes in sentiment. But they can also be subject to longer-term or secular swings. The next chart shows the contribution to rolling 10-year share market returns in the US from dividends, earnings and changes to valuations (or PEs).
Source: Bloomberg, AMP Capital
And here it is for Australia, albeit for a shorter period as the PE series for Australia does not go back as far as in the US.
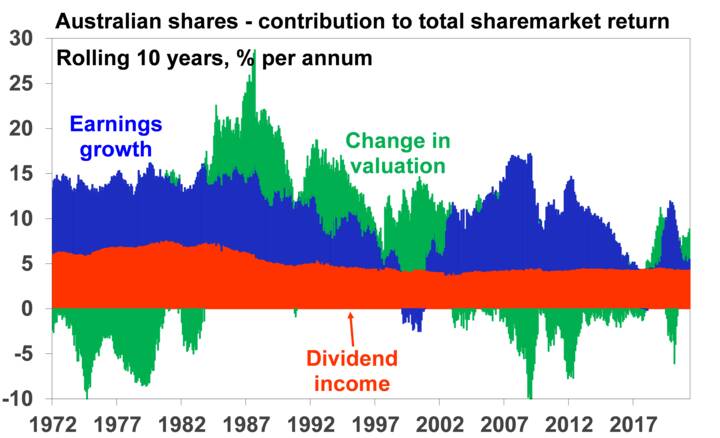
Source: Bloomberg, AMP Capital
The change in valuations or PEs (the green portion) was a big boost for US share market returns in the 1960s (as PEs rose), then it became a big drag in the 1970s (with virtually all of the return contribution from earnings offset by falling PEs), but became a big positive (often running at 5% pa or more) from the early 1980s into the 2000s and even recently (with PEs rising). Several factors impacted this including the optimism of the go-go years of the late 1960s, the supply side revolution of the 1980s and the 1990s tech boom which were positive for PEs. But a big driver was the swing in inflation from low in the 1960s to high in the 1970s (which pushed PEs down), to then low again from the 1980s (which pushed PEs up).
Inflation and PEs
The next chart shows the long-term relationship between US inflation and the US price to earnings ratio. The PE tends to fall as inflation moves up (as occurred in the 1970s) and it rises when inflation falls (as has occurred over the period since the early 1980s), although it’s less clear once inflation falls into deflation. Oddly enough it seems the market’s preferred inflation rate is the same as the Fed’s, ie, about 2%!
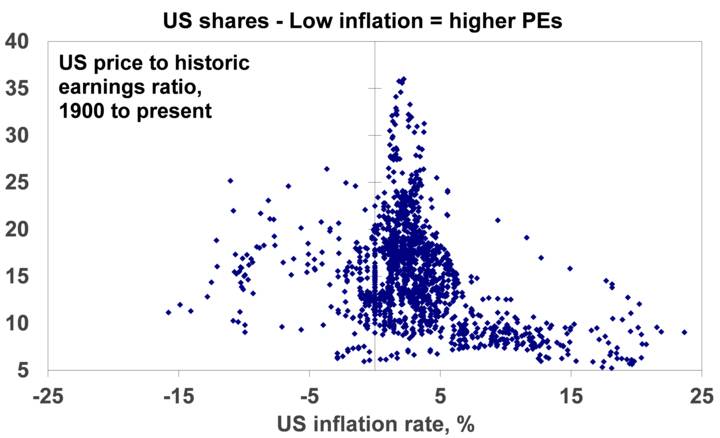
Source: Bloomberg, AMP Capital
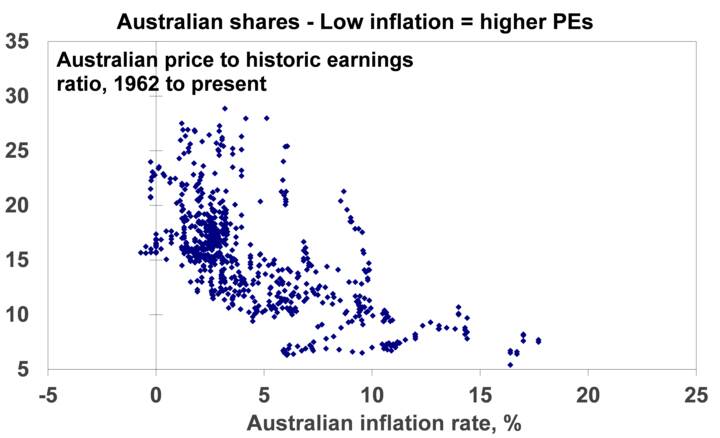
The next chart shows the same relationship for Australia although it only goes back to 1962 as our PE data does not go back as far.
Source: ASX, Bloomberg, AMP Capital
There are three drivers of the inverse relationship between PEs and inflation:
- First, low inflation means lower interest rates which boosts the value of future profits and dividends making shares more attractive. Or put simply lower inflation and interest rates boosts the attractiveness of higher yielding assets so investors switch into those assets which pushes up their price relative to their earnings, dividends or rents and so their yield goes down.
- Second, low inflation means reduced economic volatility and uncertainty, hence investors are prepared to price shares on higher price to earnings multiples.
- Finally, low inflation means improved quality of earnings as firms tend to understate depreciation when inflation is high and so overstate actual earnings. So again, investors are prepared to pay more for shares when inflation is low.
Of course, if inflation becomes deflation it can be bad to the extent its associated with economic contraction. But assuming deflation is avoided the bottom line is that a shift from high inflation to low inflation drives PEs higher (and yields lower), and vice versa for a shift from low inflation back to high inflation.
The bottom line
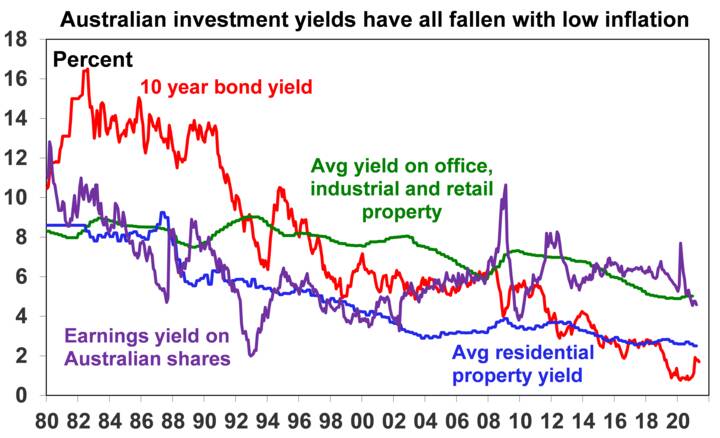
The bottom line is that share market returns have been boosted since the early 1980s as PE multiples rose (or earnings yields fell) on the back of the downtrend in inflation over the last 40 years. This phenomenon has also boosted returns from other growth assets like property, which have also seen a significant rise in prices relative to rents as evident in a sharp fall in rental yields as can be seen below – notably for residential property.
Source: REIA, JLL, Bloomberg, AMP Capital
So, if inflation rises sharply in the years ahead this could start to reverse the boost to returns from growth assets seen since the early 1980s as investors demand lower price to earnings and lower price to rents ratios (or higher yields).
As we discussed in Inflation Q&A, inflation is likely to rise further in the next few months, which could push bond yields higher and threaten share valuations (particularly high PE stocks, like tech), but with the rise in inflation being driven by base effects and bottlenecks associated with the pandemic and reopening this should be transitory. However, in a longer-term context we are likely now seeing the bottoming in inflation & long-term bond yields after a 40-year downtrend. This will mean that the tailwind which has helped propel growth assets higher – as lower inflation drove ever lower yields and higher PEs which in turn meant higher returns than would be implied by increases in earnings and rents alone – will start to fade, resulting in returns more constrained to underlying yields and earnings/rental growth. Inflation around central bank targets is the best scenario as it would still mean low inflation – but less risk of deflation & likely higher wages growth and investment returns would still be ok. The risk would be if inflation gets out of control again on a sustained basis, then the valuation boost from low inflation will be reversed, resulting in poor returns from growth assets. This is not our base case given central banks are still focussed on inflation targets and technological innovation will impose some brake on inflation, but it’s a risk.


