Introduction
For the past four decades a key feature of investment markets has been a super cycle bull market in bonds that saw 10-year bond yields fall from around 16% to lows last year around zero (and well below in some countries). This multi decade decline helped propel a global “search for yield” by investors that has pushed down yields and pushed up prices of most other assets. Underpinning it has been a collapse in inflation globally. While there have been numerous premature calls over the years that the super cycle bull market in bonds is over (including some from me) its looking increasingly likely that this time for a bunch of economic and political reasons it may actually be over. This note looks at why and what it may mean for investors.
How bonds work
But first a bit of context in terms of how bonds work. They can be a bit confusing but my high school economics teacher belaboured the point that yields move inversely to price and so it’s always stuck with me. If the government issues a bond (which is basically a fixed amount of debt with a fixed interest payment) for $100 and agrees to pay $3 a year in interest, this means an initial yield of 3%. The higher the yield the better, but in the short term the value of the bond will move inversely to the yield. If growth and/or inflation slows and the central bank cuts interest rates, investors might snap up the bonds paying $3 till the yield is pushed down to say 2%. In the process, the value of the bond goes up giving a capital gain. This is what’s happened in recent decades. But if growth or inflation pick up and bond yields rise, investors suffer a capital loss. This is what’s happened over the last 12 months with Australian bonds losing 1.5% over the year to September and global bonds losing 0.8%. Of course, if you buy a 10-year bond yielding 16% and hold it till it matures (10 years) the return will be 16% p.a. But if the starting yield is just say, 1.8% that’s all you will get for 10 years.
A bit of history on super cycles in bonds
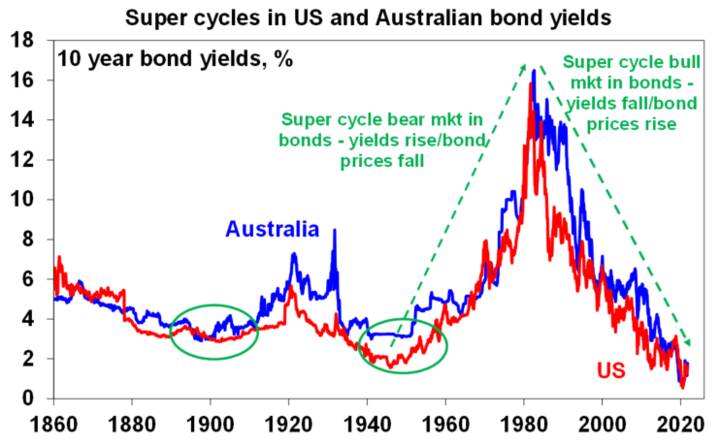
Over the last 80 years there’s been two big secular or long term moves in bond yields – up for around 40 years and then down. The next chart shows US and Australian bond yields from 1860.

Source: Bloomberg, AMP Capital
• The near 40-year super cycle rise in yields into the early 1980s was driven by rising inflation on the back of expansionist fiscal and monetary policies after the Great Depression and WW2, monetary financing of the Vietnam War, rising commodity prices, protectionism and slowing productivity along with rising economic uncertainty resulting in higher real yields. This saw 10-year bond yields in the US and Australia rise from around 2% to 4% in the 1940s to around 16% in the early 1980s.
• Then from the early 1980s it abruptly changed as a near 40-year super cycle decline in bond yields set in. This was driven by aggressive inflation fighting central banks in the early 1980s and 90s, supply side reforms, globalisation, lower costs and increased competition flowing from digitalisation, rising inequality depressing spending, spare capacity and reduced worker bargaining power with worries about deflation in recent times combined with safe haven investor demand for bonds, rising demand for safe income yielding assets as populations age, excess global savings & central bank bond buying since the GFC. This saw 10-year bond yields plunge to around 0.5% last year in the US and Australia (and even lower in other countries).
Bond yields on the rise
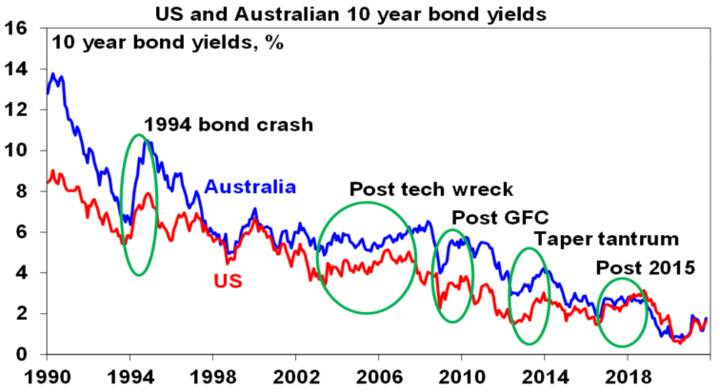
After their lows last year bond yields surged into early this year only to pull back again but they bottomed a few months ago well above last year’s lows and are threatening to rise above the levels seen early this year. See the next chart. The resumption of the rise in bond yields reflects a decline a new coronavirus cases globally leading to renewed optimism that reopening globally will be sustained, the continuing rise in global inflation readings not helped by the surge in energy prices and more central banks starting to remove stimulus.

Source: Bloomberg, AMP Capital
Of course, cyclical upswings in bond yields in economic recoveries are normal and no reason for alarm. Particularly if they are gradual and offset by higher earnings in the case of shares. And the long-term bond bull market since the early 1980s has seen several upswings in yields (see the green circled areas in the last chart) only to see the declining trend resume. So, the same could happen this time.
The end of the super cycle bull market in bonds
However, there are good reasons to believe that that long term super cycle decline in bond yields is over and that the trend is shifting to the upside for bond yields:
• Major central banks are now more aggressive in seeking to boost inflation – since the start of the pandemic this has become evident in large scale money printing, a surge in money supply growth and key central banks committing not to raise rates until inflation is sustainably at target with tolerance for an overshoot. This is particularly the case for central banks that have seen inflation underperform their targets – notably the Fed, ECB and RBA. This is different to much of the period since the 1980s that saw central banks raise rates when they forecast inflation to rise which had the effect of heading off any significant rise in inflation.
• Massive fiscal stimulus has provided an avenue for rising money supply to boost spending and hence inflation in contrast to last decade which saw fiscal austerity.
• The political pendulum in Anglo countries is swinging back to the left with more intervention in the economy – in the US under President Biden this is focussed on reducing inequality (which is positive for spending) and policies designed to shift power back to workers from companies.
• Moves to combat climate change – entailing massive investment in green technologies globally and the associated risk of higher energy prices until the adjustment is complete (as we are seeing now) risk adding to inflation.
• Globalisation is starting to reverse – reflecting a desire to bring the production of some things back onshore to protect supply chains along with tensions with China. It means less global competition and potentially higher prices over time.
• We are seeing a decline in workers relative to consumers as populations age which means more constrained labour supply and greater worker bargaining power.
• Investors have been very long in bonds as indicated by cumulative inflows into US bond funds & ETFs as opposed to equity funds and ETFs. These positions could be shaken if bond yields rise significantly leading to capital losses.
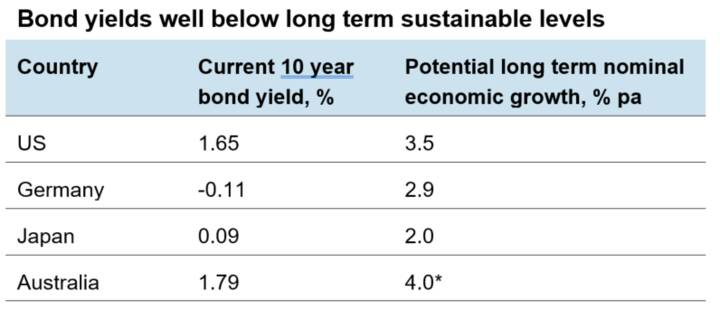
• Bond yields around zero hit a bit of a natural barrier and it’s hard to see negative or near zero interest rates being sustainable on a very long-term basis. Over the long-term nominal bond yields tend to average around long-term nominal GDP growth. Even on the basis of our conservative long-term nominal economic growth expectations, 10-year bond yields are well below sustainable levels.

* Assumes a gradual return of immigration. Source: Bloomberg, AMP Capital
Much of the current surge in inflation globally can be tied to the pandemic which has disrupted production and boosted demand for goods resulting in supply shortages – which should subside with reopening. However, beyond the next 12 months or so the first six points are consistent with the view that the long-term decline in inflation since the 1970s is likely over, with the risk that it will trend higher over the decade ahead. And the trend in inflation is a key driver of the trend in bond yields.
But bond yields will likely trend up gradually
While we may have seen the end of the super cycle decline in bond yields, the shift to a rising trend will likely be gradual with periodic spikes and then setbacks as we have seen this year:
• In the past, bond yields have gone through a base building process over several years after a long-term downswing as it takes a while for inflation expectations to turn back up.
• The global monetary cycle is only turning gradually & it will be a while for interest rates to reach high or onerous levels.
• In contrast to the 1970s inflation expectations are much lower which makes it harder for short term price spikes to turn into permanently higher inflation (although lots of price spikes at once are adding to the risk here).
• High private debt levels mean that rate hikes will be more potent than they used to be – so central banks like the RBA won’t have to raise rates as much to control inflation.
• Technological innovation and the competition it brings will act as a partial countervailing force to higher inflation.
• High public debt levels may see some central banks under political pressure to limit the rise in bond yields and hence public debt interest costs (although as we saw in the 1970s this form of price control can only last so long).
Implications for investors
There are several implications. First, expect mediocre returns from sovereign bonds. 10-year bond yields of 1.8% in Australia imply bond returns over the next decade of just 1.8%! And at times, rising bond yields will mean capital loses.
Second, higher bond yields can be bad for shares as they make them more expensive. Shares will be okay if the rise in yields is gradual & so can be offset by rising earnings – as we have seen this year with now another strong earnings reporting season in the US offsetting concerns about inflation and higher bond yields – but a sharp rise in yields will be a concern.
Thirdly, the rise in bond yields will favour share market sectors that can benefit from economic recovery via higher earnings – like industrials, banks and resources stocks.
Fourth, for shares and real assets like commercial property and infrastructure, a rising trend in bond yields will reduce the tailwind they have seen from investors buying them for yield & enabling them to trade on higher PE multiples and lower yields.
Finally, rising bond yields are pushing up fixed mortgage rates again in Australia and this along with poor affordability and higher required debt interest rate buffers will drive a further slowing in residential property price gains into next year.


