Introduction
The march of central banks towards tighter monetary policy has stepped up over the last few months. Central banks in Norway, New Zealand and South Korea have raised interest rates, the Bank of Canada has ended quantitative easing and brought forward its expected first rate hike, the Bank of England looks likely to start raising interest rates soon, and several emerging market central banks have raised rates.
In the US the Fed has flagged that it’s likely to announce the start of tapering its bond buying at its meeting this week. This is likely to see its current bond and mortgage-backed securities buying program of $US120bn a month reduced by $US15bn a month such that it ends by mid next year. The Fed’s post meeting statement and press conference is also likely to be a bit more hawkish reflecting more concern about inflation and rate hikes are likely to start in the second half of next year.
And in Australia, having reduced its weekly bond buying from $5bn to $4bn, the RBA has now ended its 0.1% yield target for the April 2024 bond (which had helped keep 2 and 3-year fixed mortgage rates around 2%) and implicitly brought forward its guidance on the first rate hike to late 2023 (previously this was not expected to be “before 2024”).
Missing in this are the Bank of Japan and European Central Bank that both show little sign of moving towards monetary tightening reflecting their history of lower inflation rates.
But the broad hawkish move by central banks has caused ongoing bouts of uncertainty in investment markets – with concern at times that central banks will be too slow to tighten which will see inflation spiral out of control, but at other times concern that central banks will raise prematurely crunching the recovery. So, should investors be concerned?
What’s driving central banks to more hawkishness?
The move to the exits from easy money reflects three key developments:
• First inflation has risen sharply in numerous countries. Much of it can be traced to pandemic-driven distortions to supply and demand – basically a surge in goods demand at a time when supply has been constrained by pandemic-related disruptions and a boost to various services prices from reopening. However, there is rising concern this could feed through into inflation expectations and lead to permanently higher inflation beyond a short-term spike in price levels.
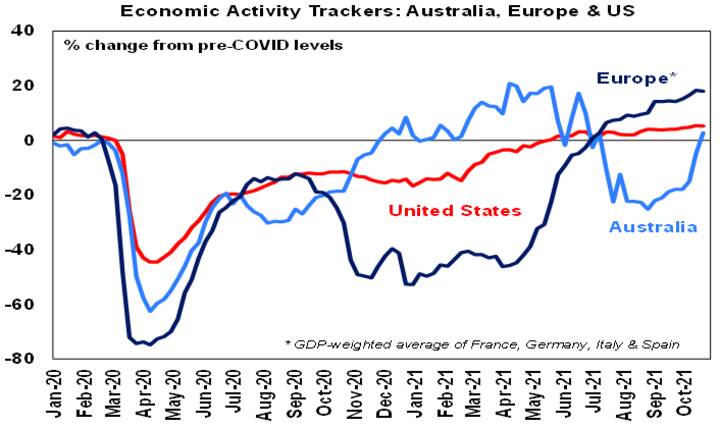
• Second, economies have been recovering with coronavirus outbreaks having smaller impacts on economic activity. And in Australia recovery now looks to be back on track after the recent east coast lockdowns. This is evident in a sharp rebound in our Australian Economic Activity Tracker.

Based on weekly data for eg job ads, restaurant bookings, confidence, mobility, credit & debit card transactions, retail foot traffic, hotel bookings. Source: AMP Capital
• Thirdly, there is increasing confidence that coronavirus is (gradually) coming under control thanks to vaccines heading off serious illness and new treatments for coronavirus.
So, in short, the need for emergency ultra-easy monetary conditions is receding.
The removal of monetary stimulus is a sign of recovery
From a broad cyclical perspective, the intensifying shift towards removing monetary stimulus should not be a major concern for investors. Although it does confirm that we have moved into a more constrained and potentially more volatile phase of the bull market in shares that began in March last year. A typical cyclical bull market in shares has three phases:
• Phase 1 normally starts when economic conditions are still weak and confidence is poor, but smart investors start to see value in shares and anticipate economic and profit recovery helped by easy monetary conditions.
• Phase 2 is driven by rising profits as economic growth turns up and investor scepticism gives way to optimism. While monetary policy invariably starts to tighten, it is from very easy conditions & remains easy so bond yields may be rising, but not enough to derail the bull market.
• Phase 3 sees investors move from optimism to euphoria helped by strong economic and profit conditions, which pushes shares into clearly overvalued territory. Meanwhile, strong economic conditions drive significant inflation problems and force central banks to put the brakes on and move into tight monetary policy, which pushes bond yields significantly higher. The combination of clear overvaluation, investors being fully invested and tight monetary policy sets the scene for a new bear market.
Right now, we are likely in Phase 2 of the investment cycle. The “easy” Phase 1 gains are behind us. Monetary support is starting to diminish and we are now more dependent on earnings growth. This shifting of the gears from the Phase 1 valuation driven gains typically sees some slowing in average share market gains. But the trend remains up and we are likely still a fair way away from the unambiguous overheating and exhaustion evident at the end of a bull market. In this context:
• Central banks are reflecting the reality of economic recovery – so the need for emergency monetary settings is receding. So, it’s really a vote of confidence in recovery. And the reduction in monetary stimulus is being offset for share markets by stronger profits. This can be seen in the current US profit reporting season which has seen 82% of companies beat expectations by an average of around 10%.
• Monetary policy remains ultra-easy and is a long way from being tight. While the Fed and RBA are slowing their bond buying, tapering is not monetary tightening, it’s just slower easing. While some central banks have raised rates, rate hikes in the US and Australia are still around a year away in our view and the ECB and Bank of Japan are further behind.
• Through the period of the last US taper from December 2013 to October 2014 US shares rose – as tapering is a slowing in easing not tightening and rates were still low. There is no reason to expect a different outcome this time, as the start of tapering in the US has been well flagged.
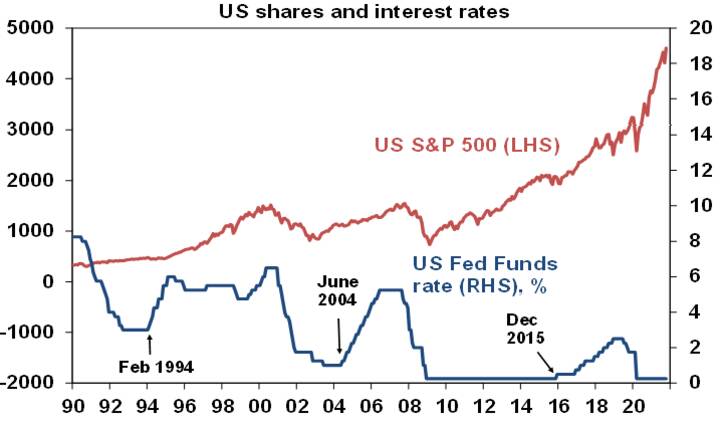
• Even if the first rate hikes from the Fed and RBA are sooner than we anticipate, the experience of the last 30 years suggests an initial dip in shares around the first rate hike but then the bull market resumes – and continues until rates become onerously tight which weighs on economic activity and profits. This can be seen in the next chart. Shares had wobbles when interest rates first started to move up in February 1994 (US shares had a 9% correction), in June 2004 (US shares had an 8% correction) and in December 2015 (US shares had a 13% correction) but thereafter they resumed their rising trend and a bear market did not set in till 2000, 2007 and 2020 after multiple hikes. Recession did not come for seven years after the February 1994 first hike, for three and a half years after the June 2004 first hike and for four years after the December 2015 first hike. This is because the first rate hike only takes monetary policy to a bit less easy, and it’s only when monetary policy becomes tight after numerous rate hikes that the economy gets hit.

Source: Bloomberg, AMP Capital
The main risk is supply constraints
Of course, the main risk is that this time is different due to supply constraints resulting in much higher for longer inflation necessitating aggressive monetary policy tightening over the next six to 12 months. The most likely scenario is that, as workers return to work with reopening (and backpackers and immigrants return to Australia) and consumer demand swings from goods back to services with reopening, goods supply bottlenecks will start to recede allowing the spike in inflation to recede later next year. Of course, this could take 6 to 12 months to work itself through, but it should ultimately delay the need for an aggressive tightening in monetary policy.
Key things to watch are: labour force participation (if it starts to rise again in the US signalling an end to the so-called “Great Resignation”), wages growth (if it becomes broad based), energy prices (coal and gas prices have fallen back lately which is a good sign), computer chip prices (with some signs that shortages are abating) and demand for goods versus services.
A comment on the RBA
While the RBA does not see the conditions being in place for a rate hike (sustained 2-3% inflation, full employment and 3% or more wages growth) until late 2023, it has effectively brought forward its assessment from 2024. And we expect that the conditions could be in place by late next year and so are allowing for two rate hikes in November and December 2022 taking the cash rate to 0.5%. That said, this is still a year away and we agree with the RBA’s assessment that inflation pressures are less in Australia than in many comparable countries. As Governor Lowe points out we have not seen the same fall in labour force participation and the impact of supply bottlenecks, has been less in Australia. Additionally, we have headline and underlying inflation around 3% and 2% respectively, compared to 5% and 3% in many other comparable countries. As a result, we see money market expectations for rate hikes starting mid-next year and taking the cash rate to 1% to 1.25% by end 2022 as being too hawkish.
While rate hikes are still a fair way off, the removal of the 0.1% April 2024 yield target implies more upwards pressure on 2 and 3-year fixed mortgage rates. The April 2024 bond yield is around 0.7% which is about 0.6% above where it was a week ago implying up to a 0.6% increase in bank funding costs for fixed mortgage lending, at least some of which is likely to be passed. While this has no impact on existing borrowers it will have an impact on new borrowers & with higher serviceability buffers implies some dampening in housing demand.
Concluding comments
The key implications for major asset classes are as follows:
• For fixed income, monetary tightening initially means higher bond yields and so is negative for this asset class. Only when monetary policy becomes tight, seriously threatening economic growth, will long term bonds decline significantly.
• For shares monetary tightening usually means slower more volatile returns but (absent external shocks) new bear markets usually only commence when monetary policies become tight and we are a long way from that.
• Interest rates are shifting from a tailwind to a headwind for Australian housing demand. Property demand tends to be more geared than demand for shares leaving the property market sensitive to interest rate moves. And fixed rates have played a bigger role lately, so rising fixed rates combined with higher serviceability buffers are likely to slow price gains further into next year ahead of likely price falls in 2023 as the RBA starts hiking.


