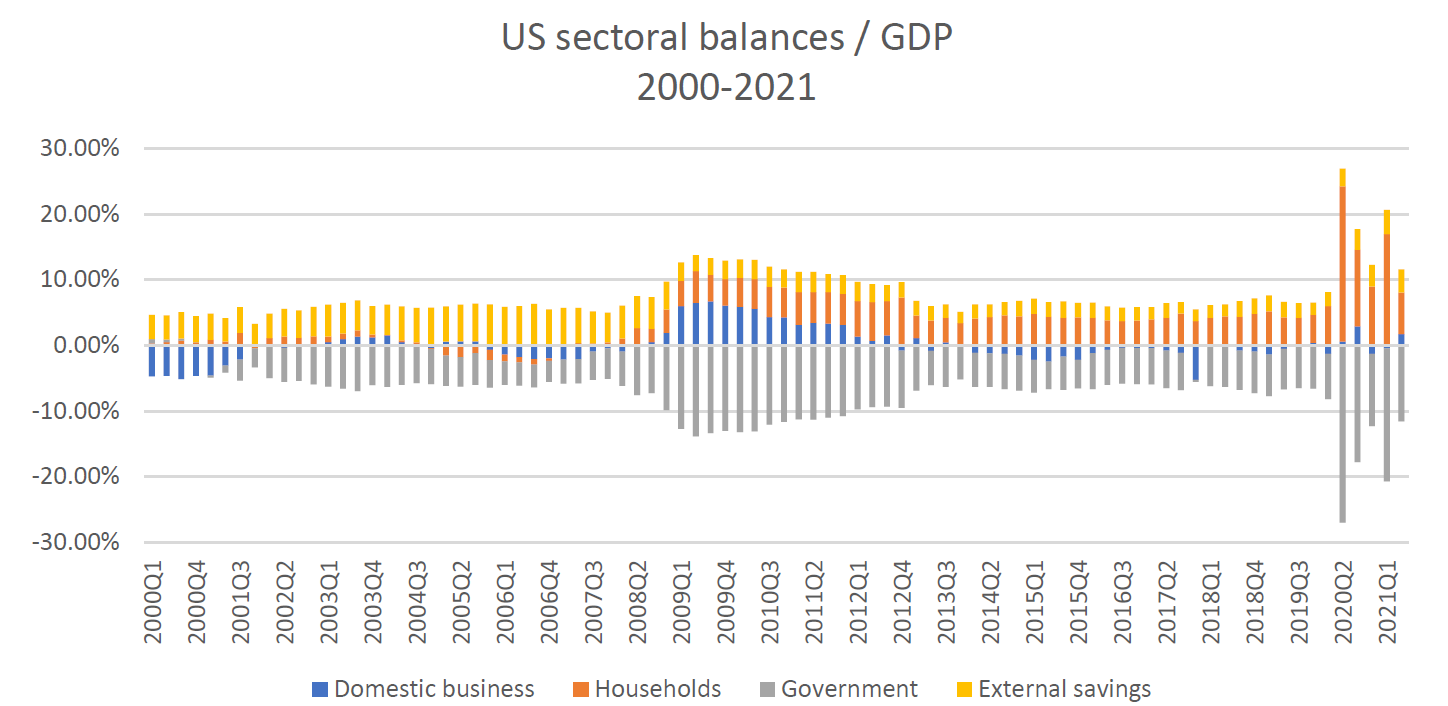
Regular readers of Investment Perspectives and our previous article on sectoral balances will have recognised that the enormous fiscal response in most countries would inevitably cause a net financial surplus accruing to the non-government sector. Nowhere has this been more on display than in the United States.
Source: St Louis Fred, US Federal Reserve, Quay Global Investors
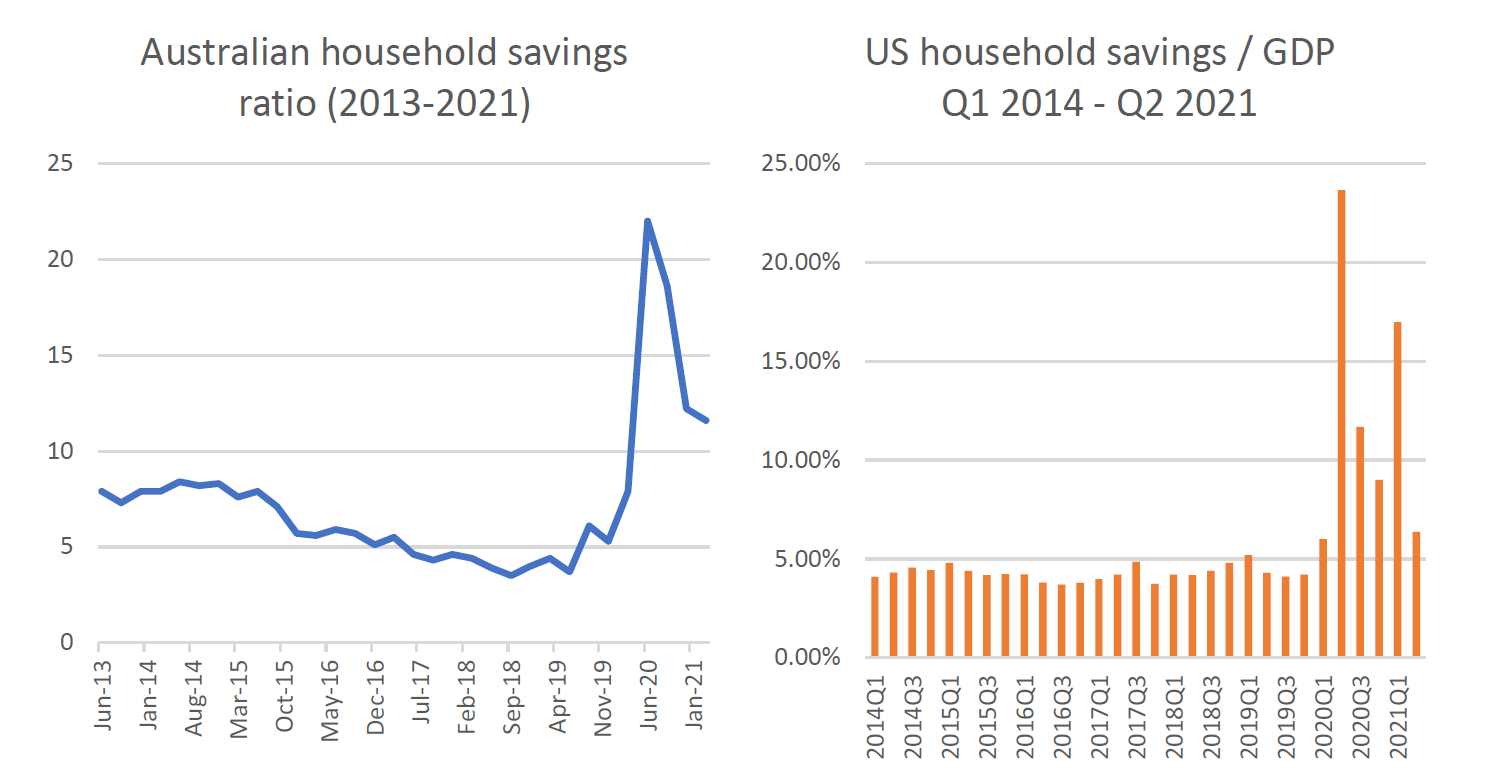
Of course, the laws of accounting apply equally in other currency issuing economies, and as such the boom in savings has occurred wherever governments ran meaningfully large fiscal deficit to combat the economic effect of the virus.
Source: St Loui Fred, US Federal Reserve, ABS, Quay Global Investors
As the charts above highlight, the rate of savings has declined as the COVID-related fiscal transfers end. In some cases, commentators have suggested such charts suggest savings are now falling[1]. Moreover, some label these transfers as a ‘sugar hit’ – and like actual sugar hits, imply a short-term high that will not last and will cause long-term damage[2].
This type of commentary misses the point that the above savings charts reflect ‘flow’ data. That is, the data is additive to the amount of savings stock across all households.
When households spend, the money usually ends up with… households
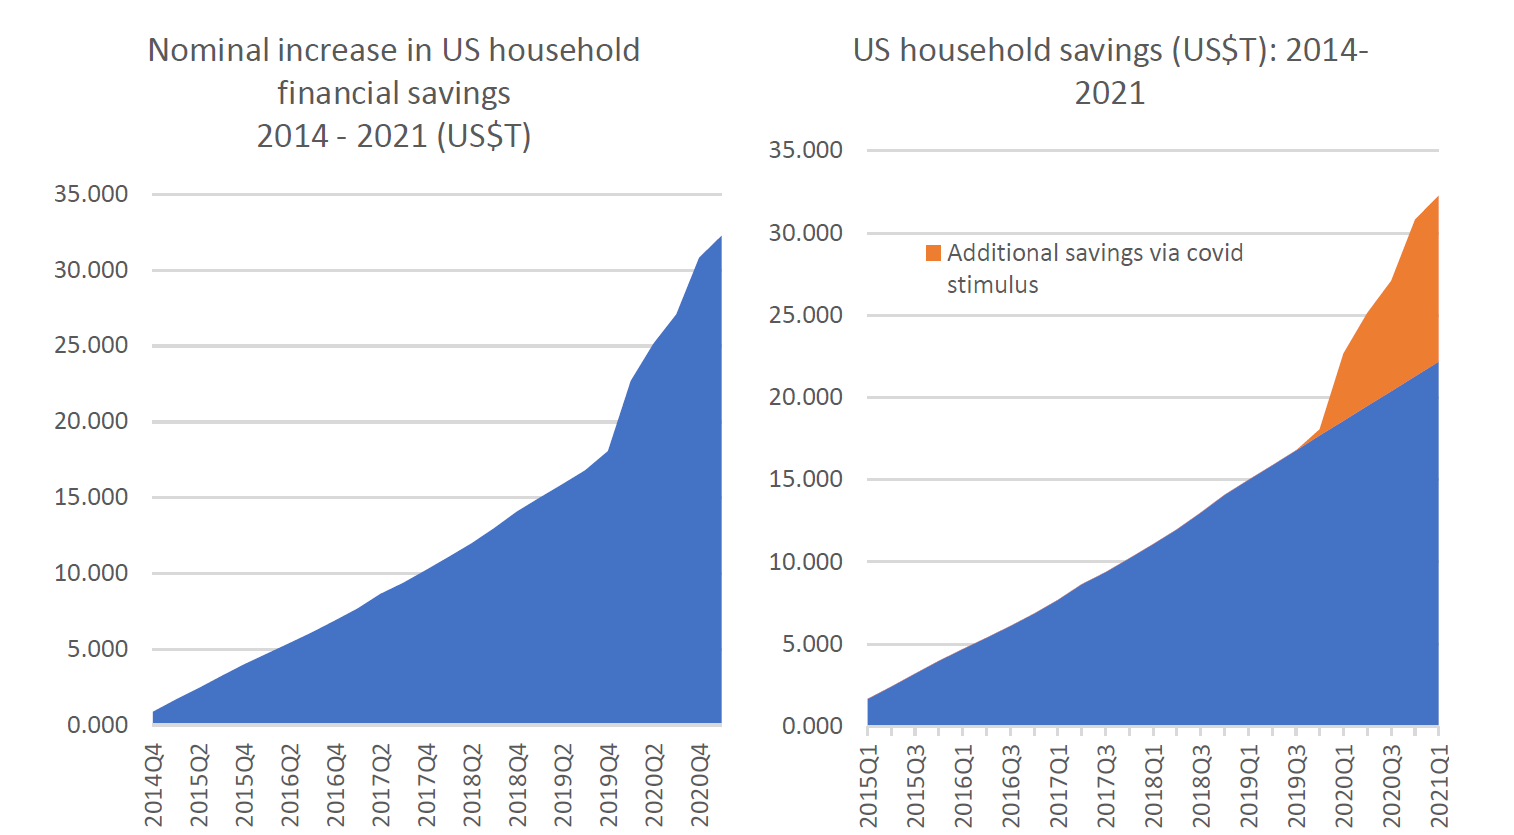
To illustrate the point, the following charts show the accumulation of US household savings since 2014 based on the flow of household savings per quarter. The left chart shows total household savings have increased by $32.3 trillion over this timeline. The chart on the right shows the difference between actual household savings, and what would have been the case without the COVID stimulus cheques (based on prior trend).
Source: St Louis Fred, US Federal Reserve, Quay Global Investors
So even though the rate of savings slows, the stock of savings continues to accumulate off a significantly higher base.
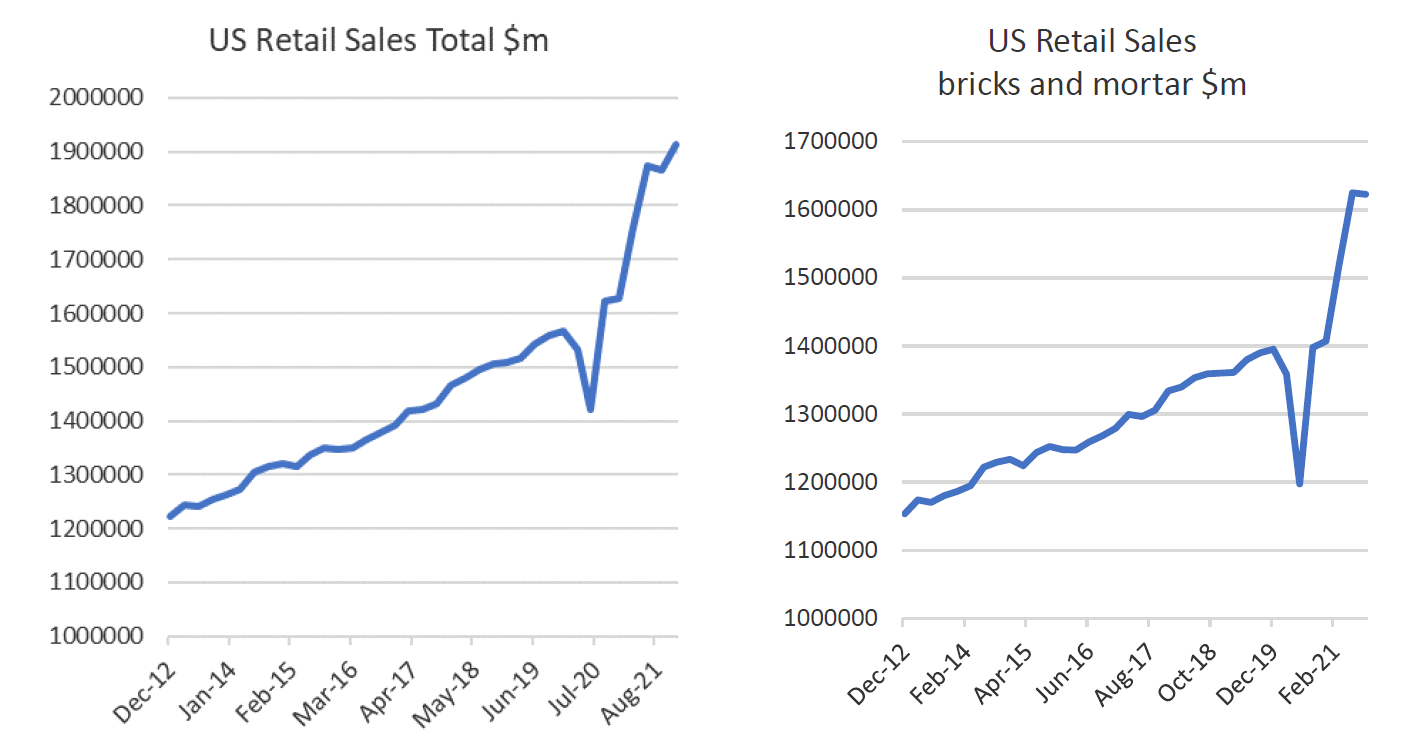
What can be sometimes confusing is how households can continue to add significantly to their pool of savings (defined as income less spending) at the same time as retail sales and consumption are booming. As the following chart highlights, current US retail sales (total and bricks and mortar) are now well above pre-COVID trend.
Source: US Census Bureau, Quay Global Investors
Understanding the apparent paradox requires one to understand that the economy is a flow machine (rather than a stock machine). That is, when households spend on a consumer item, the money does not disappear – it will end up in the till of the retailer, which in turn is used to pay wages, rents, dividends etc. Some of this money is retained by businesses for future investment as profits (see our article on the Kalecki profits equation), but most cash finds its way back into the hands of the household via the above mentioned wages, dividends, rent etc. Therefore, household consumption can boom, and savings remain high.
Ultimately, the sectoral balances inform us that the only way for the non-government sector to run down its savings is if the government runs sustained fiscal surplus. Given most sovereign currency issuing governments now realise they are not, and have never been, fiscally constrained (see our article on Modern Monetary Theory), this seems unlikely in the medium term.
Moreover, it is likely the rate of household savings (in the US and elsewhere) will remain elevated for the foreseeable future for two reasons.
- The passing of the recent US$1.0T infrastructure plan will ensure the fiscal deficit remains elevated, adding to non-government savings.
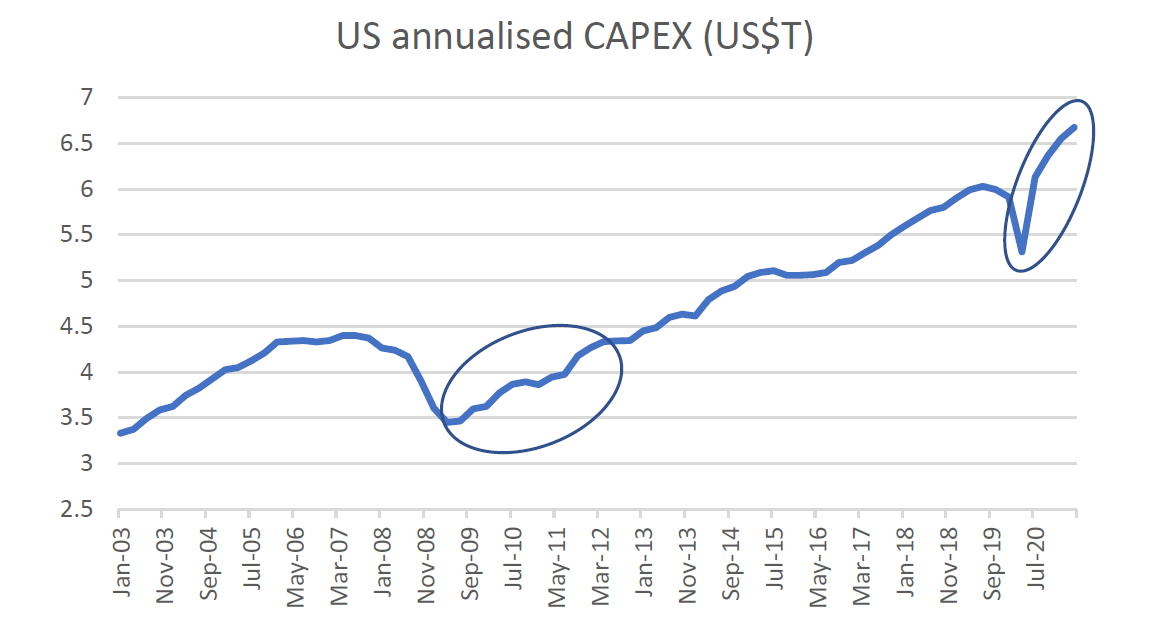
- Strong consumer demand may kick off an extended private sector CAPEX cycle – which means companies will spend more than their free cashflow. As companies runs cashflow deficits, all other things being equal, the resulting cash surplus will spill over to households and the foreign sector as per the sectoral balances.
Like government spending, the contribution to household savings from company CAPEX is significantly greater compared to the post GFC period of 2009-2012.
Source: St Louis Fred, Quay Global Investors
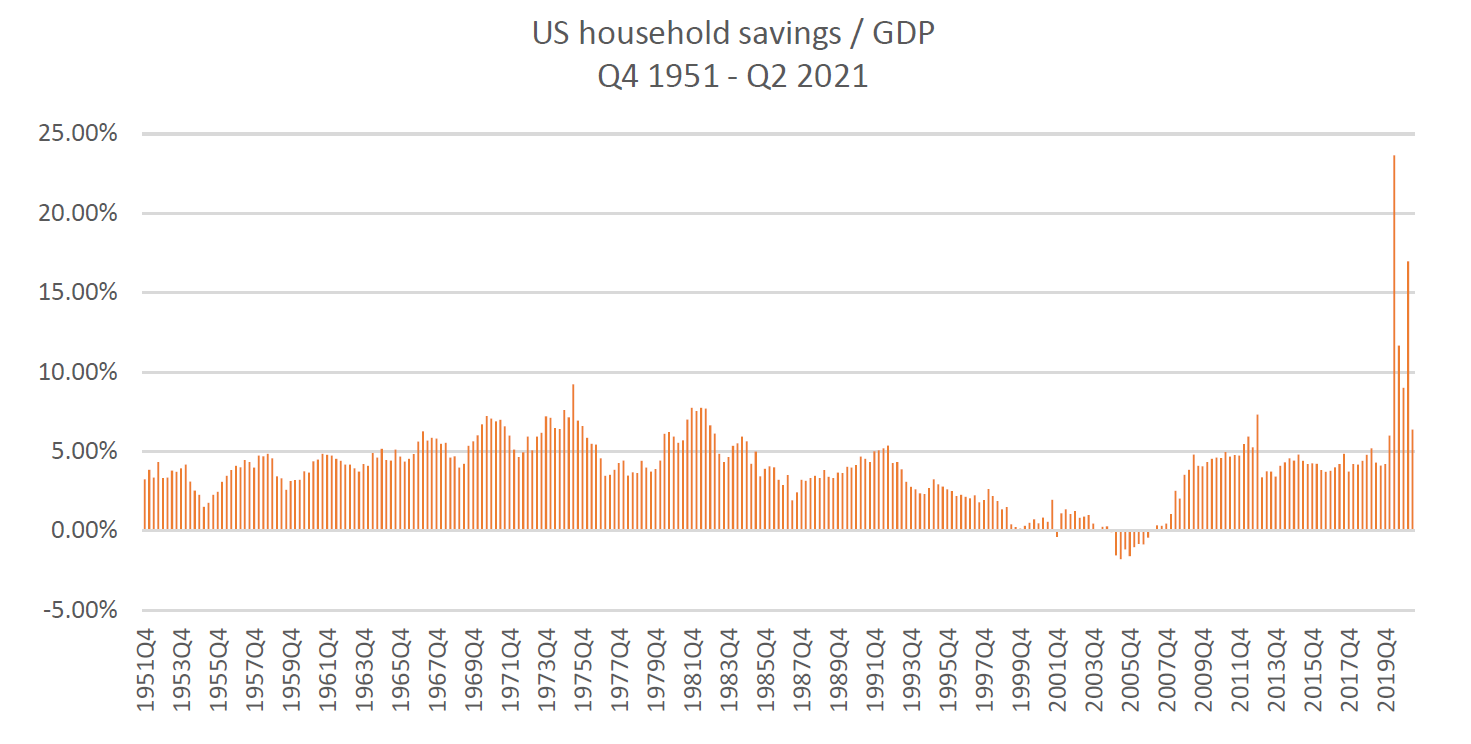
A once in a multi-generation recapitalisation of household balance sheets
The following chart places the recent boom in US household savings into context. This is not a normal cycle – not many readers of this article (including ourselves) are fully equipped to understand the macroeconomic ramifications of such an incredible sea change in policy and household financial health. The only comparable period was probably the net fiscal transfers from WW2, which set up the US middle class to boom for the following 20-30 years.
Overall, it feels like it will be somewhat dangerous to bet against the US consumer (and the US economy in general) any time soon.
Source: St Louis Fred, US Federal Reserve, Quay Global Investors
The Quay Global Real Estate Fund invests in a number of global listed real estate companies, groups and funds. The Fund aims to generate a real total return of at least 5% above CPI per annum over a 5+ year investment horizon.
ENDNOTES
1 Money.com, People’s Savings Are Plummeting to Pre-Pandemic Levels, 3 November 2021
2 The Australian, Enjoy the sugar hit as we flirt with economic ruin, 17 May 2021


