In this article, Sarah Shaw (Global PM & CIO) and Greg Goodsell (Global Equity Strategist) visit the key economic factors currently in play, consider other recent developments that could impact the global economy over the medium to long term, and discuss what this means for the investors in the global infrastructure sector.
Economic outlook for 2023 is challenging
The key concern in global equity markets remains ongoing inflationary pressure and the impact of monetary tightening undertaken by central banks in combatting inflation, potentially pushing economies into sharp slowdowns and maybe even recession. This is reflected in a selection of recent global forecasts and downgrades.
Bloomberg economics (2.4% growth)
The world economy is facing one of its worst years in 30 years as the energy shocks unleashed by Vladimir Putin’s war on Ukraine continue to reverberate. Growth is forecast to be just 2.4% in 2023. That’s down from an estimated 3.2% in 2022, and is the lowest since 1993, excluding the GFC in 2009 and the recession from the pandemic in 2020.
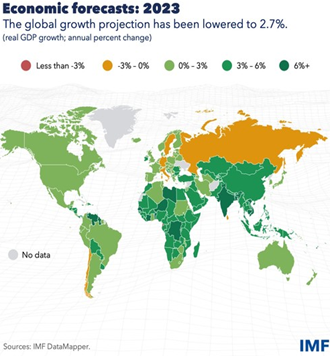
IMF World Economic Outlook (2.7% growth, 6.5% inflation)
Global economic activity is experiencing a broad-based and sharper-than-expected slowdown, with inflation higher than seen in several decades. An evolving cost of living crisis, tightening financial conditions in most regions, Russia’s invasion of Ukraine and the lingering COVID-19 pandemic all weigh heavily on the outlook.
As per the diagram, global growth is forecast to slow from 6% in 2021 to 3.2% in 2022 and 2.7% in 2023. This is the weakest growth profile since 2001, except for the global GFC and the acute phase of the pandemic. Global inflation is forecast to rise from 4.7% in 2021 to 8.8% in 2022 but to decline to 6.5% in 2023 and to 4.1% by 2024.
OECD (2.2% growth)
The global economy is facing mounting challenges amid the largest energy market shock since the 1970s and the cost of living crisis from rising inflationary pressures.
While major, recognised forecasts see a sharp slowdown in growth through 2023 and a spike in inflation. Controversially, we can also find some positives in the above data sets.
- Growth is still forecast to be positive – slower, but growth.
- Inflation is largely expected to turn a corner in 2024 – an inflationary spike rather than structural long-term inflation – and global monetary tightening is expected to be effective.
- The dynamics are very regionally dependant, and also regionally managed so we are not looking at global level recession at this stage. For example, inflation in the emerging world is much more contained than the developed world.
- The re-opening of China could mitigate domestic shocks, although the current COVID-19 outbreak in China is threatening near-term growth prospects.
- A more ‘normalised’ economic environment is actually welcomed after 15 years of low growth and no inflation – we appear to be over-shooting on the rebound, but a return to GDP growth with moderate inflation over the medium-term is positive.
Inflation and rising interest rates
Clearly, a key concern in the 2023 outlook for equity markets remains the ongoing inflation pressure and the risk that central banks overreact in their monetary tightening. US Federal Reserve Chair, Jerome Powell, said in December 2022 that the Fed is “not close to ending its anti-inflation campaign of interest rate increases” as officials signalled borrowing costs will head higher next year.
“We still have some ways to go,” he said after the Federal Open Market Committee raised its benchmark rate by 0.50% to a 4.25%-4.5% target range in the December meeting. Policymakers projected rates would end 2023 at 5.1% before being cut to 4.1% in 2024 – more than previously forecast.
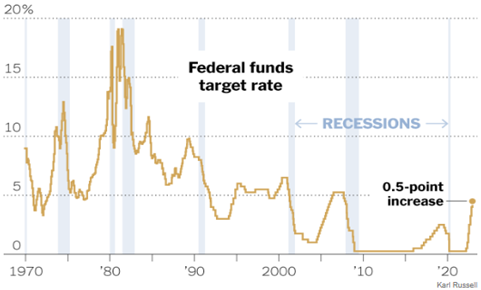
Other central banks are similarly concerned about inflation, with seven of them handing down policy decisions just after the Fed did in December. Five of them raised rates by 0.5% (ECB, BoE, SNB, Denmark and Mexico), one by 0.25% (Norges Bank) and one by just 0.235% (Taiwan).
The one exception to general global monetary tightening was the Bank of Japan (BoJ). At its meeting in December, as expected, the BoJ kept its policy rate unchanged at minus 0.10%, and left its 10-year government bond yield target at 0%. Less expectedly, the BoJ widened the band around the bond yield target from +/- 0.25% to +/- 0.50%. This decision sent shockwaves throughout financial markets. The JPY appreciated ~4% against the US$, yields on Japanese, German and US 10-year bonds rose and stock markets fell.
While general monetary policy tightening has been fast and a shock to a world that has enjoyed over a decade of record low interest rates, we are certainly not back to the stagflation era of the 80s. We’re actually tracking in line with longer-term historical averages. The sharp moves must be accommodated, and hopefully will have the desired impact of slowing economic activity and easing inflation.
The question then becomes: how does infrastructure, as an asset class, shape up in such an environment?
Infrastructure assets have very unique characteristics and very important ones in the current environment, notably:
- investment returns are underpinned by regulation or contract; and
- inflation hedges are inherent in the asset’s business models.
What becomes relevant in the current environment is how quickly inflation and changes in interest rates can be passed through to company earnings profiles. To illustrate this, we revisit the two economically diverse infrastructure sub sectors – user pay assets and regulated utilities – and how targeted, sector/stock selection in portfolio construction means an infrastructure portfolio can be positioned to take advantage of the growing long-term structural opportunities, as well as the short-term cyclical macro outlook.
User pay assets: often with built-in inflation protection mechanisms
User pay assets are those where a customer, or ‘user’, pays for the service provided, such as a toll road. These stocks have a direct positive correlation with growth (volumes) and often have built-in inflation protection in their business models via mechanisms to increase their tariffs in line with inflation. As interest rates/inflation increase over time, these protection mechanisms positively impact earnings and improve valuations due to the compound effect. This should then ultimately be reflected in the relevant stock price and performance. These types of assets should represent a core portfolio holding in a growth/inflationary environment.
Regulated utilities: timing of inflation pass through is key
In contrast, regulated utilities, such as electric or gas utility companies, can be more adversely impacted by rising interest rates/inflation because of the regulated nature of their business.
There are two key factors to consider in an inflationary environment: the speed in which inflation flows through to companies’ tariffs, and who bears the onus of maintaining the affordability of bills for the end customer.
A utility that operates under a ‘real return’ model will recover the impact of higher inflation in revenues on an annual basis, much like a user pay asset. This model is more prevalent in parts of Europe and Brazil, for example, and limits the immediate impact of inflationary pressure. In fact, it can positively boost near-term earnings and long-term values. A company such as Iberdrola, listed in Spain but with utility operations around the globe, is a net earnings beneficiary of inflation.
In contrast, if the utility doesn’t have this direct inflation pass through, it must bear the inflationary uptick reflected in certain costs until it has a regulatory ‘reset’. This is where, in determining a regulatory decision, the regulator is expected to have regard for the increased costs borne by the utility company as a result of the inflationary forces. However, as the regulator is looking to ensure affordability for customers, there is regulatory risk for companies in being fully remunerated for increased costs. This model is applied for many US utility companies.
The important point to note is that certain utilities, depending on their tariff structure, will weather inflationary spikes a little better than their peers.
Rising interest rates and infrastructure assets
In terms of interest rates shifts, all utilities are the same. For a regulated utility to recover the cost of higher interest rates, it must first go through its ‘regulatory review’ process. While the regulator is required to have regard for the changing cost environment the utility faces, the process of submission, review and approval can take some time, or can be dictated by a set regulatory period of anywhere between one to five years. Due to a regulator’s concern around bill affordability the dynamics surrounding higher costs, household rates and utility profitability can be politically charged. As a result, both the regulatory review process and the final outcome can be quite uncertain and potentially restrictive on shareholder returns, as we are seeing in the US at the moment, with rate cases being denied or significantly amended to avoid ‘rate shock’.
- DTE Energy, which is largely considered a strong operational performer among peer US utilities, received a regulatory decision in November 2022 allowing a revenue increase of just $31 million based on a 9.9% equity return (ROE), compared to the company’s proposal of a $367 million increase based on a 10.25% ROE. The major contributor to the variation was differences in forecast power demand for the coming three years and a lowering of the ROE in an interest rate rising environment. This could result in significant revenue underperformance for DTE Energy.
- In May 2022, regulatory support staff in New York provided a recommendation on Consolidated Edison’s rate case filing in the state. The recommendation proposed an allowed ROE of 8.8% and equity ratio of 48%; significantly below the company’s proposal of 10.0% ROE and 50% equity ratio. Management subsequently outlined that the operating expense allowance recommended is expected to be inadequate to cover costs, and the actual achieved equity return would be even lower than the 8.8% recommended– among the lowest levels across the US.
All else equal, the differences described above between user pay and regulated utility assets, should see certain infrastructure sub sectors fundamentally outperform during a rising inflation/interest rate period due to a more immediate and direct hedge or flow through of their increased costs.
How is 4D’s portfolio positioned?
Consistent with the case we make above, we remain overweight user pay assets and within the regulated utility sector, favour those with inflation pass through. However, should the market overreact to the economic outlook and selloff in 2023, we would use it as a buying opportunity across all sectors. Alternatively, should we see widespread recession, we would expect a re-weighting to demand resilient utilities.
COVID-19 on the increase
COVID-19 infections, hospitalisations and deaths are on the rise. Many nations dropped precautions against the spread of variants. Clearly, the world has moved on to living with the virus rather than trying to eradicate it. How it trends over coming months will be important in determining actions needed and its impact on economic growth.
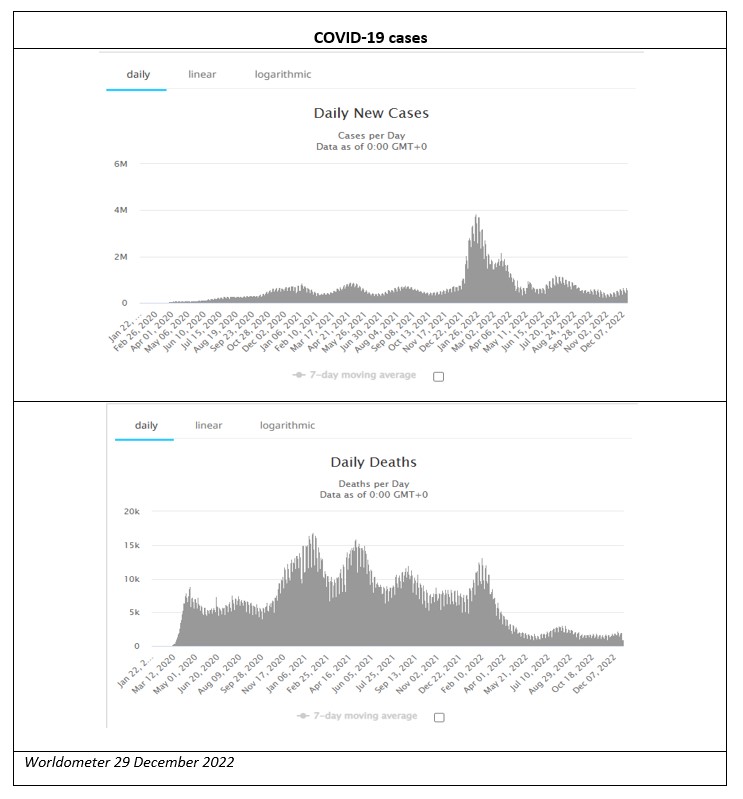
China is easing its COVID-19 restrictions, which should be positive for economic growth, but the near-term health costs could be high, and potentially erode some of those gains.
The re-opening of China could benefit a world anticipating their own domestic slowdown.
- Stimulus will increase demand for global products such as iron ore and steel.
- We’re expecting a second wave of global travel in 2023, as 140mn people (10% of the Chinese population with passports) who have been largely locked down for three years are allowed to travel.
- Political focus in China has flipped from ‘COVID zero’ to economic growth, with significant stimulus anticipated in the form of, among other things, the property sector restructure and infrastructure buildout.
However, following the easing of COVID-19 restrictions, China is grappling in the short term with what’s shaping up to be the biggest outbreak ever seen. Almost 37 million people may have been infected on a single day in China in December 2022, and the situation is expected to worsen before it improves. Peak cases are expected in mid-January, and the world will be monitoring this closely to see whether China is likely to save global growth in 2023 or add to the global slowdown due to health cost.
Ukraine war: horrific outcomes and huge, ongoing cost for Russia
Russia invaded Ukraine on 24 February 2022, and the results, especially for the Ukrainian people, have been horrific. The impact for Russia has also been horrendous, with numerous battle ground defeats and troop losses. Media reports suggest a frustrated Vladimir Putin has lost more than 105,000 soldiers and an eye-watering number of vehicles as his war continues to falter. An average of 30 tanks and armoured trucks are destroyed each day by defenders.
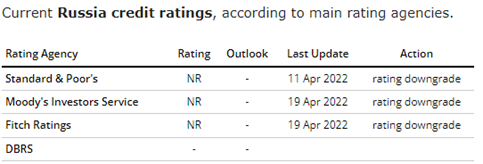
It’s also worth noting that the long-term economic cost of the war for Russia will be immense. As the charts below illustrate, the road back to global financial normality for Russia is significant. The Russian CDS[1] value, at 13k+, suggests a very high implied probability of default[2]. It’s a long way back from there.
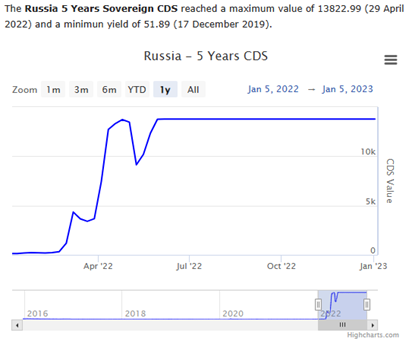
Similarly, all the major credit rating agencies have withdrawn their Russian credit ratings.
Source: World Government Bonds
In addition, Putin’s conscription of hundreds of thousands of Russians for his war on Ukraine, not to mention the hundreds of thousands more who fled to safety, is gutting Russia’s economy, according to Bloomberg. A record depletion of workers is fast spreading across a country already hobbled by an ageing and shrinking population, and with unemployment near the lowest it’s ever been. At the same time, it will likely be a long time before the rest of the world will rely on Russian exports. Clearly, the long-term cost of the Ukraine war to Russia is immense.
Positively, from an infrastructure standpoint, the war and the associated energy crisis across Europe has highlighted that the ongoing global energy transition towards Net Zero must be managed in a socially responsible way, with security of supply a priority. This realisation has fast tracked the build of new renewables sources, increased investment in grids to enable its distribution to end users, and reaffirmed transition fuels such as gas in the shift.
Global debt: going up in US$ terms, but not on a GDP basis
We monitor trends in global debt as many a financial crisis has had its origins in excessive debt levels.
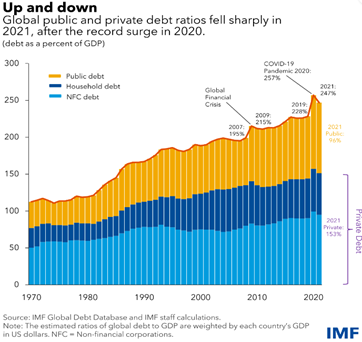
According to IMF research, total public and private debt decreased in 2021 to the equivalent of 247% of global GDP, falling by 10% from its peak level in 2020. In US$ terms, however, global debt continued to rise, although at a much slower rate, reaching a record US$235 trillion at the end of 2021.
Private debt, which includes non-financial corporate and household obligations, drove the overall reduction, decreasing by 6% to 153% of GDP. The decline of 4% for public debt, to 96% of GDP, was the largest such drop in decades.
Unusually large swings in debt ratios have been caused by the economic rebound from COVID-19 and the swift rise in inflation that has followed, according to IMF. Despite likely further improvements in 2022, global debt remained nearly 19% of GDP above pre-pandemic levels at the end of 2021, suggesting it’s a metric worth continuing to monitor.
We have been highlighting for some time that the rising public sector debt load may lead to more privately funded infrastructure projects as governments around the world grapple with the debt burden and turn to increased private sector involvement. This is an opportunity we continue to look to capitalise on.
Global population: going up
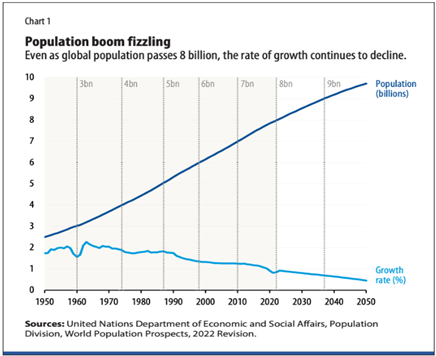
According to UN estimates, the total world population passed 8 billion on 15 November 2022, a milestone in human development. This unprecedented growth is due to the gradual increase in human lifespan owing to improvements in public health, nutrition, personal hygiene and medicine. It’s also the result of high and persistent levels of fertility in some countries.
While it took the global population 12 years to grow from 7 to 8 billion, it will take approximately 15 years—until 2037— for it to reach 9 billion, a sign that the overall growth rate of the global population is slowing. However, even with slowing growth, the global population is expected to well exceed 11 billion by the turn of the next century. A growing global population drives an obvious need for new, improved and expanded infrastructure development. Importantly, much of this population growth is coming from the emerging world where demographic trends are very supportive of economic evolution and infrastructure investment.
However, the population growth and changing dynamic is also creating a number of demographic challenges, key of which are an ageing population and environmental concerns. Again, both can represent an infrastructure opportunity. The former in increasing demands on government budgets in terms of pensions and health, and the latter in the need for increased investment opportunities.
Cash remittances: vital for emerging economies
Cash remittances are a vital source of household income for low and middle income countries (LMICs), according to the World Bank. They alleviate poverty, improve nutritional outcomes, and are associated with increased birth weight and higher school enrolment rates for children in disadvantaged households. Studies show that remittances help recipient households to build resilience, for example, through financing better housing and to cope with the losses in the aftermath of disasters.
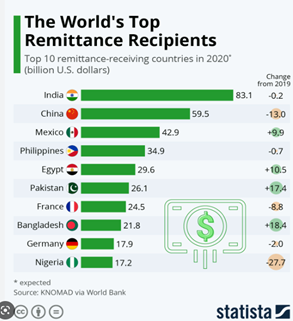
Overall remittances to LMICs withstood global headwinds in 2022, growing an estimated 5% to US$626 billion. We monitor them as they are an indicator of wealth redistribution, the evolution of the middle class and, ultimately, a demand for infrastructure.
India, Asia’s third largest economy, is on track to have received more than US$100 billion in remittances through 2022. This will be the first time a country will reach that milestone figure. Over the last few years, Indians have moved to high skilled jobs in high income countries such as the United States, United Kingdom and Singapore — from low-skilled employment in Gulf countries such as Saudi Arabia, Kuwait and Qatar — and are sending more money back home as a result, the World Bank report said.
As emerging market wealth improves, the demand for infrastructure grows. Looking at it from an individual’s perspective – as personal wealth increases, consumption patterns inevitably change. This starts with a desire for three meals a day, moves to a demand for basic essential services such as clean water, indoor plumbing, gas for cooking/heating and power – which requires infrastructure. With power comes the demand for a fridge or a TV, which increases the need for port capacity and logistics chains. It progresses over time to include services that support efficiency and a better quality of life, such as travel, which increases demand for quality roads and airports.
One of the clear and early winners of increased remittances is the growth in the middle class and their demands for infrastructure – another opportunity we look to capitalise on.
Conclusion: infrastructure remains the place to be
The 2023 macro outlook remains challenged as the inflation/interest rate risk remains prevalent. However, some green shoots may be emerging and, really, is it truly as bad as markets suggest? US inflation metrics look to have improved slightly, while the Federal Reserve Chair slowed the pace of interest rate increases, but remains vigilant in its fight against inflation.
We believe that infrastructure, as an asset class, can always play a vital role in portfolio construction via the provision of stocks with inflation pass through, visible and resilient contracted or regulated earnings profiles, and exposure to numerous long-dated growth thematics. However, given the inflationary outlook we may face in 2023, we currently favour user pay assets and real return utilities as we move into the new year.
While conscious of the economic backdrop and positioning to make the most of in country cyclicals, we also remain optimistic about the long-term fundamentals underpinning the infrastructure investment case. The thematics that we continue to capitalise on include:
- the re-opening trade – capturing the stimulus and pent up consumption around the world – 2023 should be China’s year;
- the global need for infrastructure investment across every country in the world;
- stretched government budgets increasing the private opportunity set in infrastructure;
- global population growth but with changing demographics…the west is getting older but much of the east younger;
- the emerging middle class offers a huge opportunity with infrastructure being both a driver and a first beneficiary of improved living standards; and
- energy transition – environmental and climatic challenges underpins the need for even more spend on infrastructure globally.
[1] A credit default swap (CDS) is a financial derivative that allows an investor to swap or offset their credit risk with that of another investor. To swap the risk of default, the lender buys a CDS from another investor who agrees to reimburse them if the borrower defaults.
[2] World Government Bonds


