The US rail industry was once a global leader in rail infrastructure development and innovation, with acclaim for manufacturing world-class locomotives and carriages. In 1934 Budd Manufacturing Co. created the Zephyr, a US diesel-powered train that broke the world speed record. The locomotive travelled from Denver to Chicago at 77 miles per hour and set the US on a course to dominate global rail development. However, over time US rail had become a forsaken sector and failed to keep up with innovations seen elsewhere in Europe and Asia, with aging rolling stock that lacked efficiency compared to competing alternatives in the air and on the roads. The post-World War II era saw the economy make a structural shift away from rail and towards expansion of the US automobile industry.
From an investment perspective, returns from rail operations became uneconomical and by the 1970s, the rail industry’s return on capital averaged just 2%. The majority of railroads in existence were in ruin, with bankrupt railroads accounting for more than 21% of North America’s rail mileage.1 This led to a number of players exiting the market.
The decline of the rail industry prompted US Congress to reform federal railroad regulation and in 1980, the Staggers Rail Act was established to alter rules around competition, service routes and pricing. The Act was instrumental in reviving the sector and promoting new investment into rail development to help create one of the most cost-effective and productive freight systems in the world.
1 Source: Chronology of America’s Freight Railroads July 2023
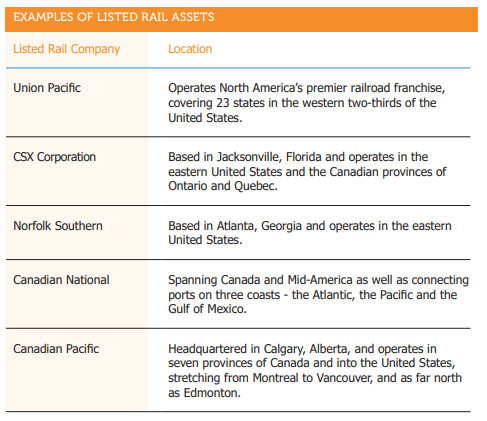
Deregulation of the industry also resulted in a number of bankruptcies and mergers, taking the number of Class I railroads in the US from about 40 down to five, effectively creating regional duopolies. By 2004, a number of the operating challenges (e.g. labour agreements) abated for the merged entities and they were able to improve operating margins. Since 2004, there has been no real evidence of pricing wars amongst the competing rail roads.
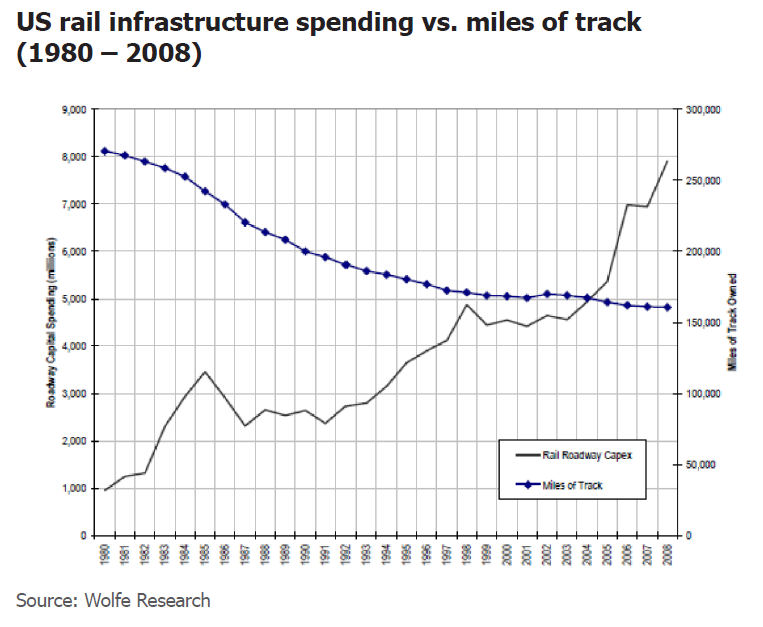
In the last 10 years, US Class I railroads have spent more than US$250 billion on infrastructure and equipment and have laid approximately six million tons of new rail. Over the last 15 years, freight railroads have invested, on average, US$24.2 billion of their own capital into improving and maintaining their networks.*
Investments have been made across the sector to expand capacity, improve transportation efficiency and forge new regional connections. Some railroad operators have established intermodal links – combining rail transportation with road or shipping services to provide freight customers with single end to end solutions. Rail intermodal transport volumes have significantly expanded since the turn of the century.
The attractiveness of rail
The synergies between regulatory support, capital investment and operational improvements have contributed to US rail now offering attractive returns on investment. North American rail operators are large corporations that benefit from scale and network effects. One of the largest operators, Union Pacific, operates the world’s largest freight rail yard. The company’s Bailey Yard in North Platte, Nebraska, covers 2,850 acres and has a total length of eight miles, making it three times the size of New York’s Central Park. The site is operational 24 hours a day, seven days a week and handles 14,000 rail cars each day that travel across the company’s 32,000 route miles.2
From agriculture to automotive parts to chemicals and coal, railroads serve practically every industry sector and forms essential infrastructure for communities. The North American rail sector is suitably diverse with an expansive network which is vital for the conveyance of bulk goods. Indeed, about 40% of intercity freight volumes in the US are moved by rail, one of the highest for any developed country.* While the sector is capital intensive, there are a number of fundamentally attractive factors for infrastructure investors.
i) Earnings have limited sensitivity to competition
- North American railroads operate within duopoly markets and hence, face limited competitive pressures. Within each of these markets, the main operators have shown discipline in pricing which has been reflected in strong returns on capital.
- Capital intensity, network effects and right-of-ways create immense barriers to new entrants.
- Rails are typically the only economical solution for shippers, particularly for long haul movements of low value heavy goods such as coal and grains. Trucks are competitive as they can provide time-sensitive delivery services for more high-value goods being transported over short-and-medium haul distances. However, their competitive advantage declines in periods of strong cost inflation given the relatively greater impact on truck relative to rail. Issues that drive inflation for trucking companies include rising labour costs, driver shortages, possible limitations on hours of service and growing costs associated with truck safety compliance regulations. Trucking companies have also been less successful in passing through rises in fuel costs.
ii) Earnings are immune from commodity price movements
- Fuel costs represent a material component of rail operating costs. Class I railroads have been successful in passing on changes in fuel cost through to customers via a contractual fuel surcharge mechanisim.
iii) Rail operators benefit from an effective regulatory regime
- Railroad regulation is somewhat light-handed and constructive. Economic regulation of railroad operators is primarily conducted through the United States Surface Transportation Board and in Canada, the Canadian Transport Agency. For US operators, the Staggers Rail Act effectively diluted the regulatory structure. Since the Act was passed in 1980, average rail rates (adjusted for inflation) have fallen 40%. This means the average rail shipper can move more freight than before for the same price paid more than 40 years ago.*
iv) Increased margins through implementation of precision scheduled railroading (PSR)
- PSR is a railroad operating model pioneered by the late Hunter Harrison. Mr Harrison first implemented PSR at Illinois Central Railroad in 1993 and went on to implement PSR at several other class one railroads including Canadian National in 1998, Canadian Pacific in 2014 and CSX in 2017.
- The core objective of PSR is to reduce the average time it takes to move a customer’s rail car from origin to destination. PSR increases the reliability of rail as a transportation method; i.e., the goods arrive at the scheduled time. The proportion of CSX trains that arrived on time increased from 51% in 2015 (prior to PSR implementation) to 75% in 2018 (post implementation of PSR).
- PSR is also beneficial for shaeholders given railroads can move the same amount of goods with fewer people and asstes. This has resulted in a material increase in margins for railroads. For example, CSX’s adjusted operating margin increased from approximately 30% in 2015 to 40% in 2018.
Demand considerations
Rail operators are also well placed to manage capacity as demand changes. An improved focus on operating efficiencies has partly mitigated the effects of the recent volume downturn. But when volumes stabilise and subsequently increase, rail operators have the flexibility to meet the upturn in demand, primarily through adding cars and lengthening trains. Further gains from technological innovation and future automation provide avenues for additional operational leverage.
An attractive sector in a dependable market
In the prevailing environment, the US economy is continuing to exhibit signs of sustainable recovery and growth in exports, which bodes well for the freight sector. Even in a low growth environment, rail operators have shown the ability to grow earnings. Following a period of increased investment to support intermodal volume growth, improve network performance and meet regulatory requirements, capital investment for rail operators can be expected to ease going forward. Considered together with improved service offerings, this should contribute to strong and stable free cash flow growth, making the sector attractive to infrastructure investors. At current valuations we have seen an attractive entry point to the North American rail sector and will be closely monitoring opportunities in this market.

Important Information: This material has been delivered to you by Magellan Asset Management Limited ABN 31 120 593 946 AFS Licence No. 304 301 (‘Magellan’) and has been prepared for general information purposes only and must not be construed as investment advice or as an investment recommendation. This material does not take into account your investment objectives, financial situation or particular needs. This material does not constitute an offer or inducement to engage in an investment activity nor does it form part of any offer documentation, offer or invitation to purchase, sell or subscribe for interests in any type of investment product or service. You should obtain and consider the relevant Product Disclosure Statement (‘PDS’) and Target Market Determination (‘TMD’) and consider obtaining professional investment advice tailored to your specific circumstances before making a decision about whether to acquire, or continue to hold, the relevant financial product. A copy of the relevant PDS and TMD relating to a Magellan financial product may be obtained by calling +61 2 9235 4888 or by visiting www.magellangroup.com.au.
Past performance is not necessarily indicative of future results and no person guarantees the future performance of any financial product or service, the amount or timing of any return from it, that asset allocations will be met, that it will be able to implement its investment strategy or that its investment objectives will be achieved. This material may contain ‘forward-looking statements’. Actual events or results or the actual performance of a Magellan financial product or service may differ materially from those reflected or contemplated in such forward-looking statements.
This material may include data, research and other information from third party sources. Magellan makes no guarantee that such information is accurate, complete or timely and does not provide any warranties regarding results obtained from its use. This information is subject to change at any time and no person has any responsibility to update any of the information provided in this material. Statements contained in this material that are not historical facts are based on current expectations, estimates, projections, opinions and beliefs of Magellan. Such statements involve known and unknown risks, uncertainties and other factors, and undue reliance should not be placed thereon. No representation or warranty is made with respect to the accuracy or completeness of any of the information contained in this material. Magellan will not be responsible or liable for any losses arising from your use or reliance upon any part of the information contained in this material.
Any third party trademarks contained herein are the property of their respective owners and Magellan claims no ownership in, nor any affiliation with, such trademarks. Any third party trademarks that appear in this material are used for information purposes and only to identify the company names or brands of their respective owners. No affiliation, sponsorship or endorsement should be inferred from the use of these trademarks. This material and the information contained within it may not be reproduced, or disclosed, in whole or in part, without the prior written consent of Magellan.


