
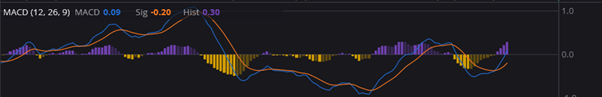
The MACD is the second most commonly used chart visualization on Marketech’s Focus platform, being saved by about 30% of our serious/active investors in their primary saved chart layout.
MACD stands for Moving Average Convergence Divergence, not that it really matters.
What does matter is that it can be a pretty handy tool in your toolbox! It’s a trend-following momentum indicator that removes a lot of the volatility noise from highly volatile stocks – all of which is important in ‘getting it right more often than you get it wrong’.
To set up the MACD only requires you to click on the chart tools in our free Focus platform (that you can get to here), because we’ve already set it up for you. It comes for free, on FocusLite for PC or our app, but you can choose to upgrade to low-cost live-data packs, either live or live-streaming, with even more functionality (and trades from $5 on HIN).
But then you’ll need to understand what the indicator is trying to tell you.
The MACD is supposed to help you to identify stocks that are about to go up, or down. And whether the underlying strength will support a bigger move, or if it looks like it could just fizzle out and leave you holding the bag.
In other words, the MACD is supposed to help you to make money in the sharemarket. So you should check it out!
Understanding the components
The MACD Line
This line is typically calculated by subtracting the 26-period Exponential Moving Average (EMA) from the 12-period EMA.
On the below image, taken from Marketech Focus, this line is blue.
But we have designed Focus so that you can adjust all these settings if you want to, or change all the colors, or make the lines thicker or change their style. Or you can have the whole thing in either dark or light mode, and all our chart indicators are available on the PC version and the app, on the free version, or the live-streaming one.
Signal Line
This is a 9-period EMA of the MACD Line. This line is orange.
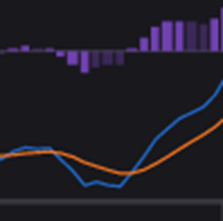
Bullish Signal
When the blue line crosses above the orange line, it indicates a potential uptrend or bullish momentum. That’s when you’re supposed to buy it, according to the MACD.
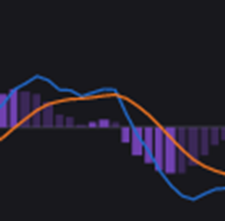
Bearish Signal
When the blue line crosses below the orange line, it indicates a potential downtrend or bearish momentum. This is when you’re supposed to sell it, according to the MACD.
The MACD Histogram
This is just the difference between the MACD Line and the Signal Line. A rising histogram indicates increasing momentum, while a falling histogram indicates decreasing momentum.
Because what you want to see in a ‘proper’ share market rally is really good momentum! Otherwise, it can just as quickly retrace, and turn a winning trade into a loser. Investors get nervous when a stock lacks conviction, or direction, so the MACD histogram can help to highlight that for you.
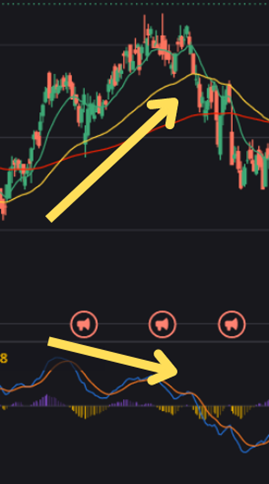
Divergence occurs when the price movement of the stock ‘disagrees’ with the movement of the MACD. For example, if the stock is making higher highs but the MACD is making lower highs, it could signal a potential reversal in the uptrend. And vice versa if you’re looking for an entry.
This is good for spotting an opportunity (or downside risk) just before it presents, then you can add it to your watchlist, stick a few price/volume/news alerts on, and watch it like a hawk!
Confirmation using other indicators. And risk management.
If the MACD was right all the time we would already be too rich to still bother with the sharemarket. It’s called an indicator because it could indicate something…
So always make sure to set your stop-losses and alerts, and look at a few more technical indicators to see if they add any insight, or even speak to a professional.
And if your current platform doesn’t have any of these things, perhaps it’s time to get a better – and probably cheaper – platform!
How to register for a free trial of Marketech’s Focus platform
All of these tools and much more (including all of the ShareCafe articles and videos linked to mobile alerts) are available on the award-winning Focus platform, for serious or active investors, on PC and mobile app. To trial the Focus platform for free, simply register with an email address by clicking here.
Many of the Focus features listed in this article are available for free. You can then choose a live price-data subscription for $20 a month, or $45 a month for live-streaming, with the added option of Cboe for $20 on either plan. Then, with live data, you can trade for $5 or 0.02% brokerage, on your own HINs, with your money in your own interest-bearing Macquarie CMA.
Marketech Focus is a market-media, data & trading platform supplied in conjunction with optional financial services, licensed to provide General Advice on Securities as Marketech Online Trading Pty Ltd (ACN 654 674 432) an Authorised Representative (1293528) of Sanlam Private Wealth Pty Ltd (AFSL 337927). The above article is general advice only.
For more information about the various features, options and fees, visit www.marketech.com.au/focus for the Terms & Conditions and the Financial Services guide.

