Business Quality is a key factor in the Airlie investment process, and we typically define a high-quality business as one that can earn a decent return on its capital. The Real Estate Investment Trust (REIT) sector is not typically thought of as a high total return sector due to the low-yielding nature of real estate and high capital intensity to just ‘stay in business’. That said, it may come as a surprise that CHC has delivered a total return of ~11.5% p.a. since its IPO in 2006. This performance has been driven largely by CHC’s transition from a traditional REIT to a fund manager, which generates fees on client capital with minimal amounts of incremental investment required.
Now, I know you are probably thinking, “Why would I want to invest in an office fund manager, particularly in the current interest rate environment?” We believe these risks are more than captured in CHC’s current price and have provided the opportunity to invest in a high-quality business at an attractive valuation.
But Office is Dead?
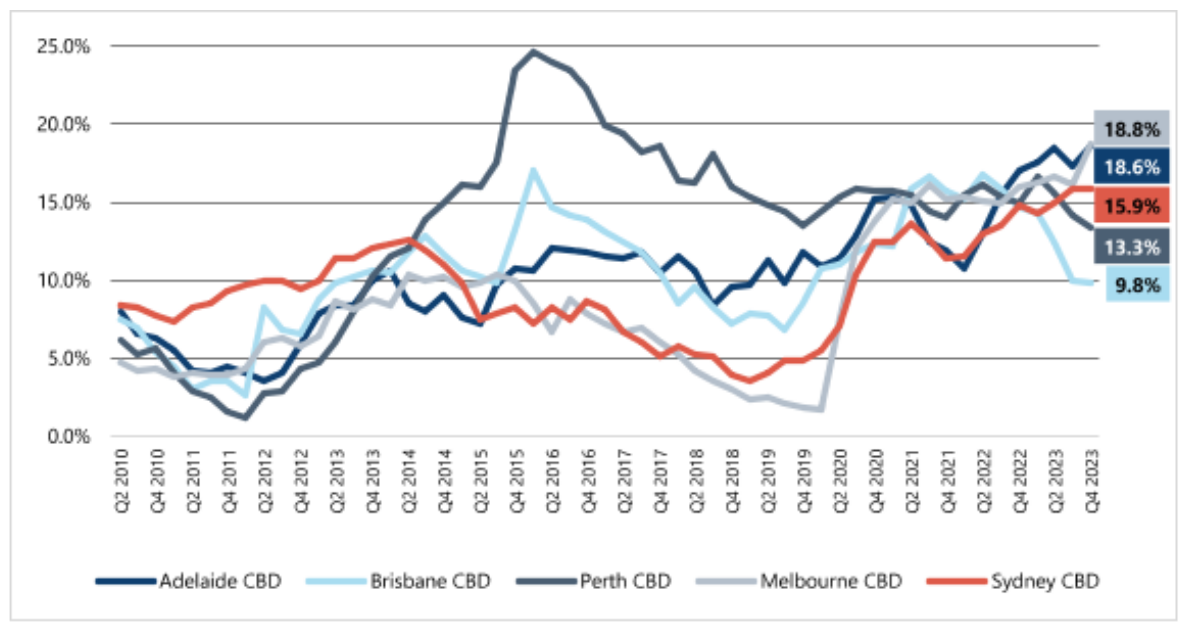
We don’t disagree that the ‘Work From Home’ trend has created meaningful challenges for the Office sector. Corporates have quite reasonably concluded they can achieve substantial rent savings while providing their workforce with increased flexibility. This has resulted in an increase in market vacancy and placed pressure on rents.
Prime CBD Office Vacancy Rates
Source: Jefferies, JLL
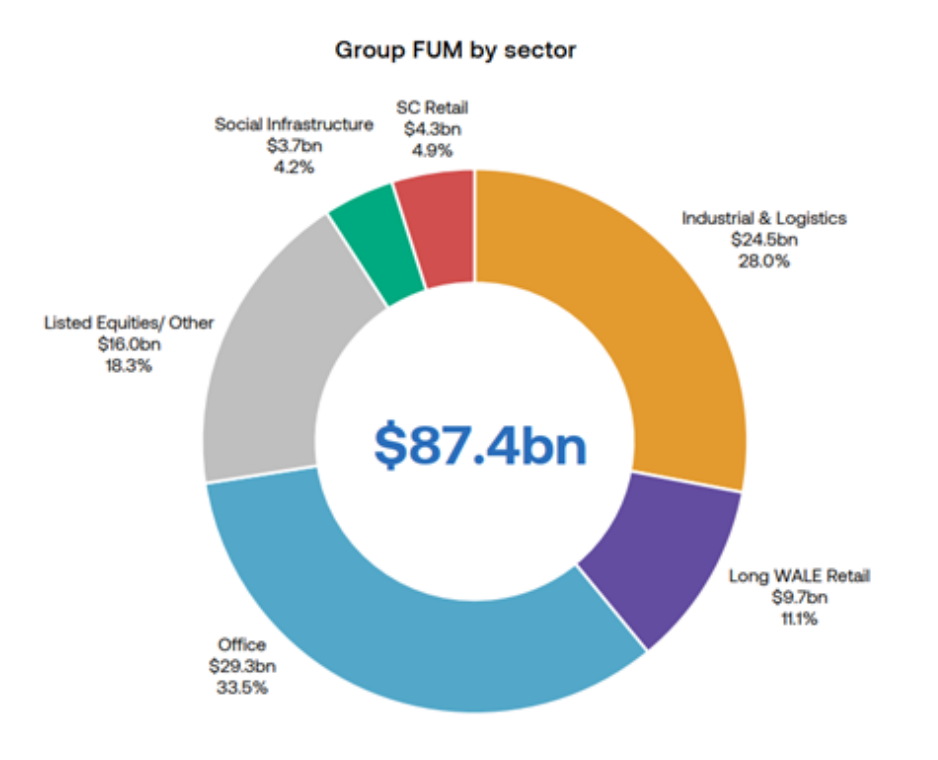
This has understandably weighed on Charter Hall, with the share price down 48% since its peak of $21.83 in 2021. While Charter Hall will undoubtedly be affected by weakness in Office, we believe the criticism is not entirely fair given roughly two-thirds of its Funds Under Management (FUM) is in ‘non-office’ sectors, including Industrial and Logistics (28%), Equities (18%), Retail (16%) and Social Infrastructure (4%).
Source: Charter Hall
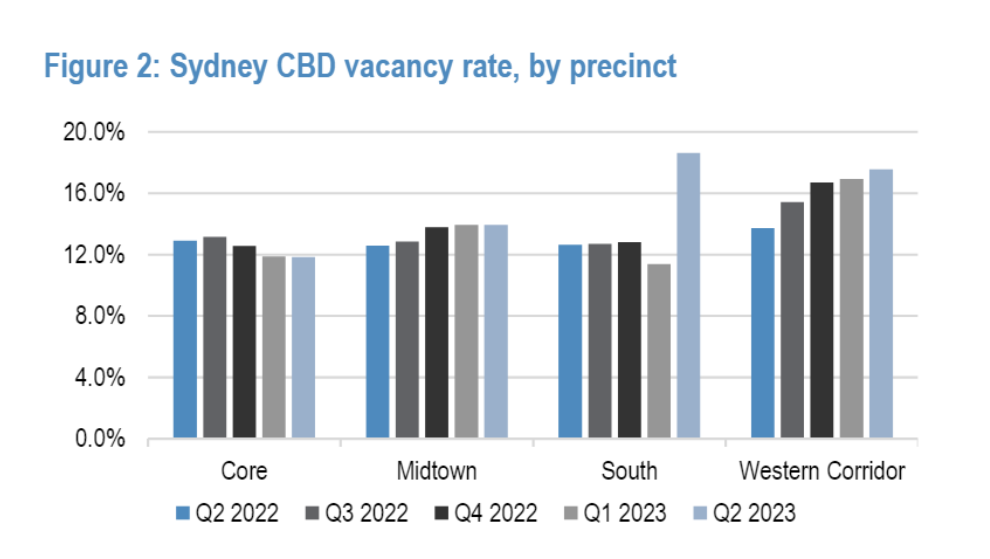
Further, the real estate cliché “location, location, location” remains as relevant as ever. The fundamentals for well-located, new and environmentally friendly buildings are markedly different from those that do not have these characteristics. The figure below highlights the divergent vacancy trends seen between core and non-core regions of Sydney CBD. Equally, the vacancy rate for buildings in Sydney that are less than 10 years old is ~6% versus ~13% for those over 10 years old (source: JLL and Charter Hall Research).
CHC’s Office Portfolio skews to newer, better-located buildings, which has led to superior outcomes including 96% occupancy (vs 85% national average), 89% leasing retention rate and a high-quality tenant base like the Australian Government, multinationals and listed companies (which account for 56% of the Group’s property platform income).
High Interest Rates?
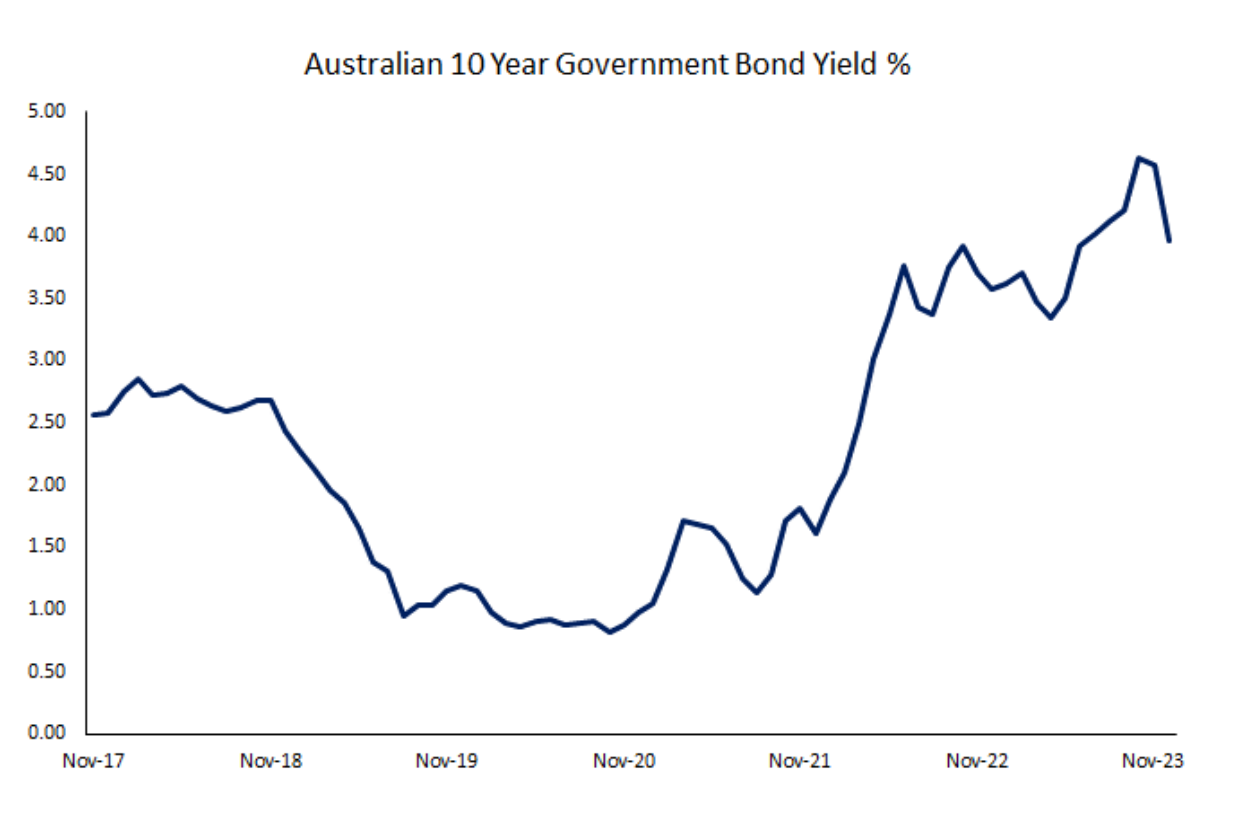
It wouldn’t be an investor communication without a quote from Warren Buffett, who said, “Interest rates are to the prices of assets like gravity is to the function of earth”. As such, it’s no surprise that the 10 Year Australian Government Bond Yield rising from <1% during the pandemic to almost 5% weighed on an asset manager like CHC. Most obviously, it has reduced the value of the assets that it manages and charges fees on.
Source: Federal Reserve Bank of St Louis
Second, the rapid increase in interest rates has frozen transaction activity in the sector with investors unwilling to make long-term, illiquid investments for fear the price of the asset could fall in the near term. This is not ideal for Charter Hall where transaction activity allows it to acquire new assets, increase its FUM and thereby grow earnings.
While we don’t claim to be economic forecasters, we’d argue that with interest rates at 10-year highs and inflation measures falling, it seems more likely than not that interest rates have peaked. We believe this peaking of interest rates is likely to see transaction activity begin to return and allow CHC to mitigate devaluations in its FUM. From FY19 – FY23 CHC added $5.7b per year to FUM from acquisitions and $2.0b p.a. from developments. Therefore, a return to average transaction and development activity would sufficiently offset a 10% decline in current Property FUM of $71b due to devaluations.
Underappreciated Business Quality
CHC trades at ~15x FY24 EPS guidance, which is a large discount to the ASX 200 of ~22x (excluding financials and resources) despite a track record of growing EPS at 15.1% p.a. over the last 10 years.
Source: Charter Hall
We believe CHC is a higher-quality business than it is given credit for, with several factors often overlooked:
-
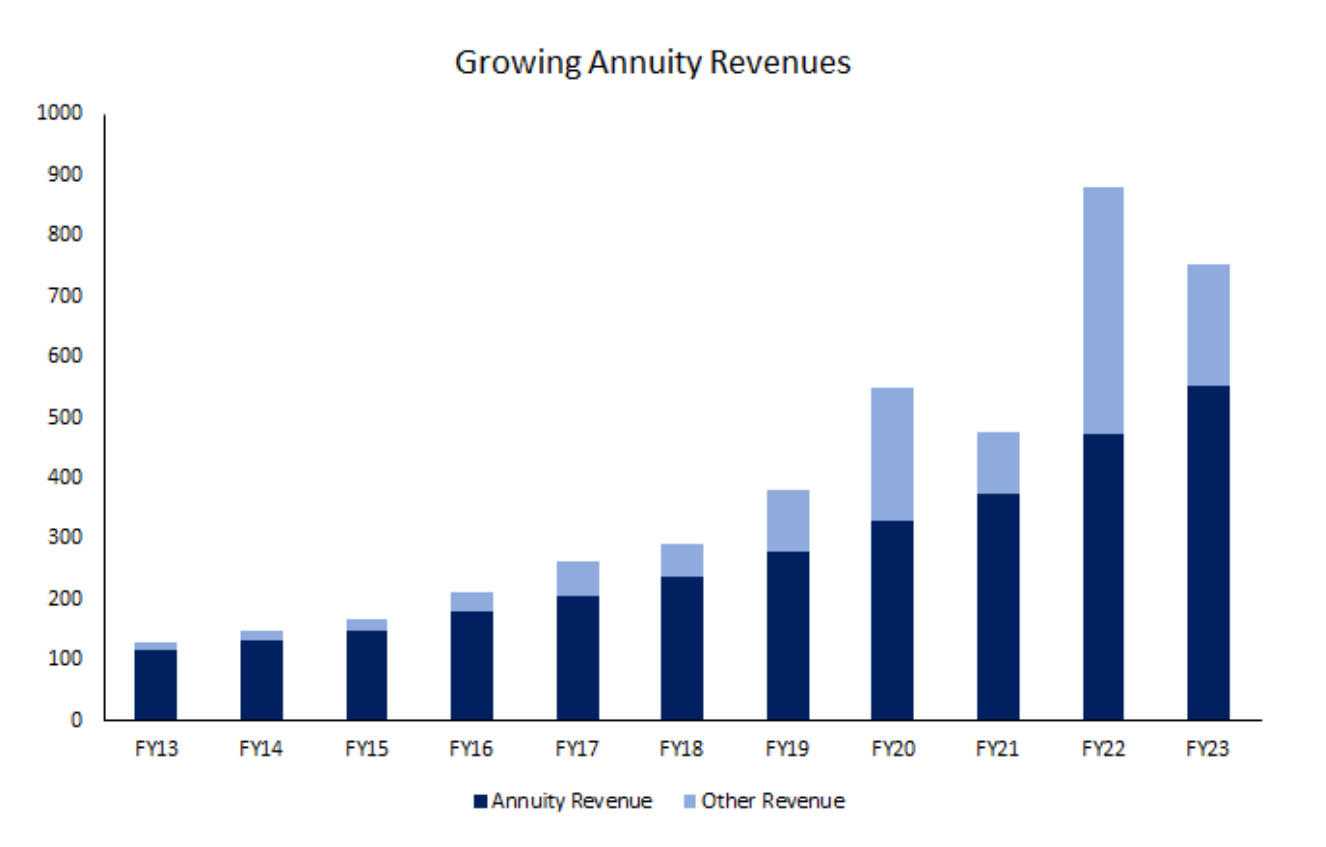
~73% of its revenues are highly recurring, creating a stable, lower risk earnings stream for shareholders, which therefore should warrant a higher multiple.
-
CHC’s FUM are relatively ‘sticky’, meaning they cannot be easily or quickly redeemed. This is somewhat a by-product of redemption terms being structured to align with the fact that the underlying investments are large and illiquid:
-
~72% of FUM is in ‘Wholesale’ (unlisted) strategies where institutional investors typically have redemption windows every 5 – 7 years, meaning they cannot pull their money out quickly.
-
~15% of FUM is in ‘Listed’ vehicles, which more or less cannot be redeemed.
-
~12% of FUM is in ‘Direct’ (unlisted) strategies for HNW individuals, which can typically be redeemed only every 5 years.
-
Many of CHC’s ‘wholesale’ investors have a lower cost of capital (return requirement), which means CHC can pay more for assets, providing it with an advantage in an auction for an asset.
-
There are few other Fund Managers in Australia with the ability to purchase large assets worth more than >$1b, which further reduces competition in auctions for CHC.
-
Funds Management EBITDA Margins have grown over the last ten years to 73%, highlighting the business’s scalability. Even after removing the more volatile transaction and performance fees, the EBITDA margin is 62%, which reduces operating leverage and creates a stable earnings stream.
-
As Charter Hall’s funds management business has delivered strong performance, and its relationship with equity partners improved, CHC has not needed to ‘seed’ its investment vehicles with the same proportion of capital. This reduces its overall capital requirements of the business, allowing for both a higher return on capital and greater returns to shareholders.
-
While there is implied leverage related to Charter Hall’s investments in its own funds, at the group level, CHC has a very clean balance sheet with virtually no net debt, which provides it with optionality, particularly in a more difficult real estate market.
Attractive Valuation
Despite CHC’s rising margins, decreasing capital requirements, proven earnings growth and business quality, it still trades at ~14x 1-year forward EPS which is well below the ASX 200 multiple of ~22x (excluding commodities and banks). Furthermore, we view the company’s FY24 guidance of 75 cents per share as ‘trough’ earnings given it implies virtually no performance or transaction fees. If we normalise FY24 performance and transaction fees to a level that is in line with historical averages, CHC would be trading at ~10x FY24 EPS. We believe that if inflation continues to fall, interest rates stabilise and there is discussion of rate cuts – as we have seen in recent months – CHC’s multiple should re-rate to account for the cyclically low earnings and depressed multiple.
By Jack McNally, Investment Analyst
Important Information: This material has been delivered to you by Magellan Asset Management Limited ABN 31 120 593 946 AFS Licence No. 304 301 trading as Airlie Funds Management (‘Airlie’) and has been prepared for general information purposes only and must not be construed as investment advice or as an investment recommendation. This material does not take into account your investment objectives, financial situation or particular needs. This material does not constitute an offer or inducement to engage in an investment activity nor does it form part of any offer documentation, offer or invitation to purchase, sell or subscribe for interests in any type of investment product or service. You should obtain and consider the relevant Product Disclosure Statement (‘PDS’) and Target Market Determination (‘TMD’) and consider obtaining professional investment advice tailored to your specific circumstances before making a decision about whether to acquire, or continue to hold, the relevant financial product. A copy of the relevant PDS and TMD relating to an Airlie financial product or service may be obtained by calling +61 2 9235 4760 or by visiting www.airliefundsmanagement.com.au.
Past performance is not necessarily indicative of future results and no person guarantees the future performance of any financial product or service, the amount or timing of any return from it, that asset allocations will be met, that it will be able to implement its investment strategy or that its investment objectives will be achieved. This material may contain ‘forward-looking statements’. Actual events or results or the actual performance of an Airlie financial product or service may differ materially from those reflected or contemplated in such forward-looking statements.
This material may include data, research and other information from third party sources. Airlie makes no guarantee that such information is accurate, complete or timely and does not provide any warranties regarding results obtained from its use. This information is subject to change at any time and no person has any responsibility to update any of the information provided in this material. Statements contained in this material that are not historical facts are based on current expectations, estimates, projections, opinions and beliefs of Airlie. Such statements involve known and unknown risks, uncertainties and other factors, and undue reliance should not be placed thereon. No representation or warranty is made with respect to the accuracy or completeness of any of the information contained in this material. Airlie will not be responsible or liable for any losses arising from your use or reliance upon any part of the information contained in this material.
Any third party trademarks contained herein are the property of their respective owners and Airlie claims no ownership in, nor any affiliation with, such trademarks. Any third party trademarks that appear in this material are used for information purposes and only to identify the company names or brands of their respective owners. No affiliation, sponsorship or endorsement should be inferred from the use of these trademarks. This material and the information contained within it may not be reproduced, or disclosed, in whole or in part, without the prior written consent of Airlie.


